
A Process Capability-Derived Scale For Assessing The Risk Of Compound Carryover In Shared Facilities
By Andrew Walsh; David G. Dolan, Ph.D.; Andreas Flueckiger, M.D.; Igor Gorsky; Robert Kowal; Ester Lovsin Barle, Ph.D.; Mohammad Ovais; Osamu Shirokizawa; and Kelly Waldron
 Part of the Cleaning Validation for the 21st Century series
A previous article discussed the development of a scale for measuring the risk of compound carryover in shared facilities in terms of the toxicity of the follow-on compound based on the acceptable daily exposure (ADE).1 This article will present another new scale based on the process capability of a cleaning process that can be used to evaluate the probability of cross-contamination by compounds manufactured in a shared facility or equipment train. This approach can be used to evaluate sample results from cleaning validations or monitoring studies for all types of cleaning, including manual, semi-automated, or automated cleaning.
As stated in the previous article, the core principles behind evaluating “risk” in pharmaceutical manufacturing were introduced in the International Conference on Harmonisation (ICH) Q9 guideline (formally adopted by the U.S. FDA in 2006),2 which mentions its applicability to cleaning (including acceptance limits) in its Annex II.4, and to validation in Annex II.6. According to ICH Q9, risk is defined as the combination of the probability of occurrence of harm and the severity of that harm. This can be expressed as:

Risk, in terms of hazard (i.e., the potential source of harm), can also be expressed as:

If the hazard is intrinsic to an active pharmaceutical ingredient (API), this general equation can be further refined to:

As discussed in the first article in this series, the ADE (which is a dose that is considered to be protective of health for all patient populations, by all routes of exposure, every day for a lifetime) provides a value that can be converted into a toxicity score and utilized in the calculation of a potential "cleaning risk" (as shown in Equation 4).

What was missing from this equation in the first article was a comparable value for the probability of exposureAPI. Since the probability of exposure is always 100 percent, and only the degree of exposure varies, this term needs to be refined. What we are more specifically interested in is the probability of residues remaining after cleaning that would exceed the ADE and put patients at risk. Consequently, what we are looking to measure is the probability of cleaning validation samples failing the limit calculated from the ADE, which can be simplified as the probability of cleaning failure. This article will explore the use of the process capability of the cleaning process as a means to measure the probability of cleaning failureAPI as shown in Equation 5.

(Note: This equation can be used with any compound that has a calculated ADE/PDE [permitted daily exposure], including cleaning agents).
Basics Of Process Capability
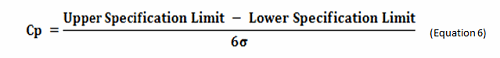
Process capability (Cp) is a simple, straightforward comparison of the spread of the process data (its variability) to the spread of the specification limit for that process. Basically, it is a measure of how well the data fits within the specifications. Figure 1 shows a plot of a hypothetical dataset that has a mean of 100 and a standard deviation of 15. In this example, suppose the specification limits for this process are 25 to 175. As we can see, the data fits well within these specifications, and they are centered within the specification limits. The process capability for this data is calculated using the following equation:
0r
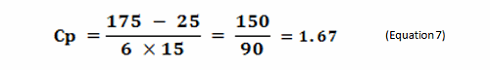
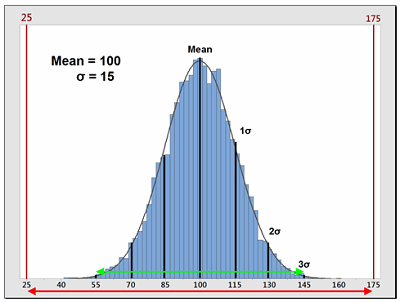
Figure 1: Example of Process Capability (Cp)
Sometimes, data is not centered within the specification range and is significantly closer to one specification limit than the other. In these cases, a modification of the Cp calculation is used that only looks at the distance of the mean to whichever specification limit is closest to the mean. This is called the process capability index (Cpk). Also, for data that has no upper or lower specification limits (such as cleaning data), a variation of the Cpk can be used instead that calculates a process capability based only on one specification (one-tail calculation). These are the Cpu (upper) and Cpl (lower) and are also simple comparisons of the spread of the data (its variability), specifically the distance from the data mean to the upper specification limit (USL) or to the lower specification limit (LSL). Since cleaning validation data does not have lower specification limits, the Cpu equation should be used as a technique to quantify the probability of being exposed to an API at or above its ADE. The calculation for the Cpu can be seen in Equation 8.
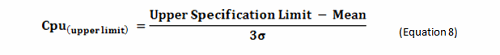

Figure 2: Example of Process Capability Index for Upper Specification (Cpu)
The terms in this equation can be obtained using data derived from cleaning swab or rinse studies as shown in Equation 9.

While this approach can obviously be applied to data that is above the quantitation limits, readers may assume that this cannot be applied to data where some, or even all, of the data are below the quantitation limit (censored data), and calculating a mean and standard deviation would seem impossible. This situation often occurs with cleaning data obtained using high performance liquid chromatography (HPLC). However, there are valid ways of dealing with censored data to obtain acceptable estimates of the mean and standard deviation that have been used in other disciplines that deal frequently with censored data.3 Therefore, these calculations can still be performed with cleaning data that have points below the quantitation limit.
In Six Sigma or Operational Excellence programs, the values generated by these process capability calculations are considered to have significance in interpreting how acceptable a process is. The guidelines that are widely used for these values are shown in Table 1.
Table 1 - Six Sigma Definitions of Process Capability Values
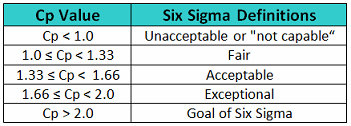
The goal of these so-called "Six Sigma" programs is to develop or improve manufacturing processes such that they have an additional 3 standard deviations (sigma) of room on both sides of their process data, which mathematically calculates to a Cp of 2.0 (Figure 3). It should be noted that, in practice, many companies have been satisfied just to reach Five Sigma (1.66) and feel that striving for Six Sigma (2.0) is not worth the extra cost and effort. Therefore, achieving a process capability of 2.0 should be considered very good.
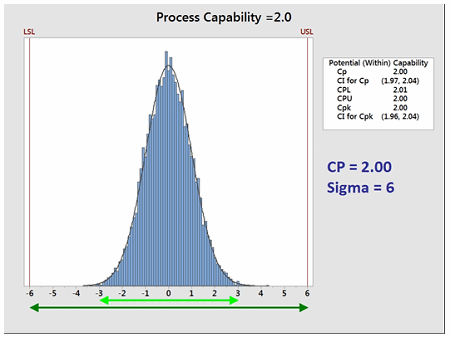
Figure 3: Process Capability of 2.0
Like other statistical parameters that are estimated from sample data, the calculated process capability values are only estimates of true process capability and, due to sampling error, are subject to uncertainty. Hence, to account for these uncertainties, it is recommended to report and use the lower confidence limit of the Cpu from these calculations instead of just the Cpu itself. Almost all statistical software in use today can provide confidence intervals for process capability values. Figure 4 shows an example using Minitab 17®. In Figure 4 below, the text box on the right from the output from Minitab reports the Cpu as 1.65 and that the 99 percent confidence intervals (CIs) for the Cpu range from 1.61 to 1.68 (Note: Minitab reports the CI for the Cpk, which is either the Cpu or the Cpl; in this case it is the Cpu).
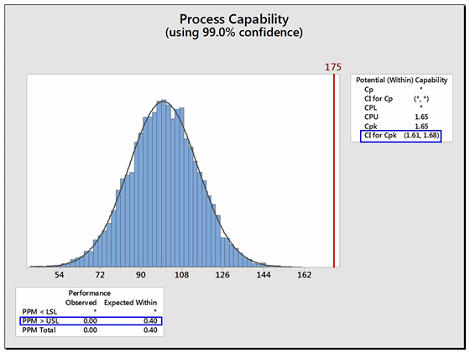
Figure 4: Example of Confidence Limit and PPM Calculations for Cpu
Minitab can also report the expected number of possible failures out of a million based on the process capability analysis. In this example, the lower text box reports, based on this data, that there are 0.4 possible failures out of 1 million (i.e., exceeding the upper specification limit). Although possible, there is a very low probability of a failure in this example.
Creating A Scale For The Probability Of A Cleaning Failure Using Process Capability
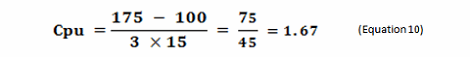
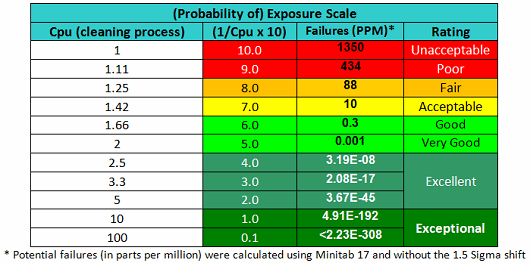
As stated, the terms in Equation 9 can be satisfied using data derived from cleaning swab or rinse studies. The Cpu values derived from cleaning data as shown in Equation 10 can be subsequently converted into a scale from 1 to 10 by simply taking their reciprocals and multiplying by 10 as shown in Table 2. This results in a scale that has a high value (i.e., 10) associated with a high probability of failure and a low value (i.e., 1) associated with a low probability of failure, as is typical of the probability scales used in FMEAs (failure modes and effects analyses). Based on the guidelines for process capability values shown in Table 1, a color gradient was added to the table cells to indicate a suggested acceptability of each score, with Unacceptable colored red, transitioning to Excellent and Exceptional, which is colored green.
Table 2 - Cpu-based Scale for Probability of Exposure
These values could then be used with a severity scale, such as the toxicity scale, to calculate a risk priority number (RPN) that could be used to rank risks identified in an FMEA for the handling or cleaning of drug compounds (Table 3).
Develop a robust, regulatory-driven cleaning validation process with the information provided by expert Thomas Woody. Click here to register for:
Cleaning Validation – Health Based Limits and Beyond: Answers to Current Industry Gaps
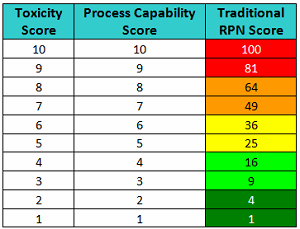
Table 3 - RPN Scores based on Toxicity Scores and Process Capability Scores
However, in order to arrive at a valid RPN value, the values of the factors used to calculate it must be from a ratio scale. As the values in this Cpu-based scale are derived directly from data and satisfy the criteria for a ratio scale, these values may be multiplied with a scale for severity to arrive at a measure of the risk associated with cleaning of a product or compound. However, the previously described toxicity scale is a logarithmic scale, and values from it cannot be multiplied with values from the process capability scale to derive any meaningful or useful result. Unfortunately, one of the issues with the scales typically used for FMEAs is that they are ordinal scales and the values in these scales cannot be meaningfully multiplied as is normally done in FMEAs. Several authors have already pointed out that the scales typically used in FMEAs to calculate RPNs may not yield useful or valid results.4-7
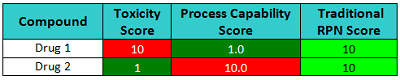
For example, in Table 4 we see two compounds that have very different toxicity scores and process capability scores and would clearly present different levels of risk. Drug 1 has a toxicity score of 10 (severe hazard at low ADE values) and has a corresponding process capability score of 1.0 (excellent cleanability), which is a low-risk situation. On the other hand, Drug 2 has a toxicity score of 1 (very low hazard due to low ADE value) but has a corresponding process capability score of 10.0 (poor cleanability), which represents a potentially high-risk situation. Yet when these two drugs are scored, their resulting RPN scores are identical, and thus this metric fails to appropriately discriminate among risks. Clearly, the result of simply multiplying these numbers could be seriously misleading. But more importantly the specific value and information provided by each score is lost.
Table 4 - Risk Scores based on Toxicity Scores and Process Capability Scores
One suggested improvement to the FMEA has been to substitute an SO (severity and occurrence) score, which is simply a listing of the raw scores side-by-side in place of the RPN/risk score.5 Table 5 shows SO scores for pairs of toxicity scores and process capability scores.
Table 5 - Level of Risk Scores based on Toxicity Scores and Process Capability Scores
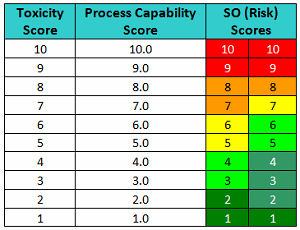
This approach is somewhat similar to the scoring of gymnasts in the Olympics. Gymnasts receive a score based on the difficulty of the performances and another based on their execution. Such an approach improves the transparency of the evaluation process. For instance, the "10/10" in Table 5 would mean it's a very toxic compound and its cleanability (ease of removal) is very poor, which translates into a very high-risk situation. A "10/1" would mean it's a very toxic compound but cleaning is extremely effective, which would result in a very low-risk situation. A "5/5" would mean it's a moderately toxic compound and cleaning is good, so it is a low risk. A "5/10" would mean it's a moderately toxic compound and cleaning is poor; it is a high risk. A "5/1" would mean it's also a moderately toxic compound, but its cleaning is extremely good, so it is a very low risk.
Now consider the SO scores shown in Table 6. The cleaning validation expert's judgment should include questions such as: Which drug poses the greatest risk (10=highest), and what is the capability of the cleaning processes (higher = worse)? What is the level of confidence to classify these compounds knowing these scores? How would this ranking compare to other rankings, and would the results be consistent?
Table 6 - Ranking by Level of Risk
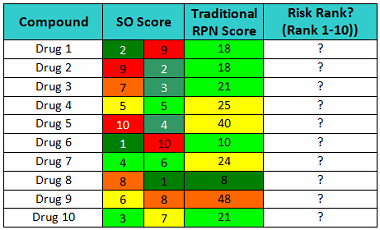
Just looking at these scores, it should be quickly obvious that Drug 1 is a low-hazard compound and the cleaning procedure is not very effective, while Drug 2 is a high-hazard compound but the cleaning procedure is very effective and robust. As a consequence, the cleaning procedure for Drug 1 needs considerable improvement to assure that any residues after cleaning are at safe levels, while Drug 2’s cleaning procedure does not. Drug 4 is a moderate hazard compound and the cleaning procedure is good, yet the traditional RPN approach scores Drug 4 as a higher risk than Drug 1. The traditional RPN Scores provide us with little information to evaluate the risk involved with these drugs. Obviously, multiplying these scores can obscure important information.
As stated in the first article, manufacturers could use the toxicity scale to evaluate new products for possible introduction into their facility or a manufacturing area. However, a new product that simply has a high toxicity score should not be rejected as a candidate for manufacture in the facility based solely on that score. A new product introduction should depend on how well the manufacturer can manage the cross-contamination risks presented by the introduction of this product. For instance, if a facility's cleaning program is capable of effectively removing residues of this new product to safe levels, then introducing this product into the facility actually presents a low risk. This new process capability scale can be used to guide the decision of whether or not a facility's cleaning program may be acceptable for the introduction of the new product.
For example, a facility's existing cleaning validation data (e.g., swab data) can be used to calculate a predicted process capability as a measure of how well the facility's current cleaning processes may be able to clean the new product. This is as simple as substituting the ADE-derived limit of the new product into Equation 9 along with the mean and standard deviation of the existing data and calculating what the process capability would be for this new product based on the existing data. This analysis could be used to guide the decision as to whether the product could be successfully cleaned by the existing cleaning process, or whether cleaning process development would be required. If the predicted process capability analysis indicates that the current cleaning process is capable of effectively removing residues of the new product to safe levels, the next step would be to run a lab-scale "cleanability" test to quickly confirm whether the new compound is significantly different in cleaning requirements than the other products manufactured. If this is not the case, the product could be quickly moved to launch, with a single verification study performed on cleaning after the first batch.
These new scales can also be used for performing cleaning FMEAs/FMECAs, which are risk assessment tools specifically for identifying the potential failures of a cleaning process that could put a patient at risk. Cleaning FMEAs/FMECAs are equivalent to worker exposure FMEAs8 that have been in use for some time, except that the focus of cleaning FMEAs/FMECAs is on patient exposure rather than on worker exposure. If the failure affects the process capability, that could result in higher process residues remaining in, or on, manufacturing equipment. Data from a cleaning process with a defined cleaning design space can be analyzed to determine whether the failure has a detrimental effect on the process capability. For example, if the process time of the cleaning is off by a few minutes, analysis of the cleaning design space may reveal a robust cleaning process and that this would not have a significant effect on the process capability or on residues of the API. Conversely, if the process time is off and the existing process capability data shows that this cleaning process is not very robust, this could have a significant effect, resulting in unsafe residues of the API remaining on manufacturing equipment. A cleaning FMEA/FMECA could also assess whether such a failure could be easily detected or might go undetected. It should be understood that cleaning FMEAs/FMECAs specifically target cleaning process failures that can result in process residues remaining and consider the severity (toxicity) of the compound that might remain and the likelihood that these residues may be present at unsafe levels. It's important to note that cleaning FMEAs/FMECAs are essentially different from equipment FMEAs, which are more focused on failures of the equipment or instruments and the likelihood of a piece of equipment or an instrument failing. Such equipment or instrument failures may or may not have an impact on patient safety.
Conclusion
During the development of Risk-MaPP9 (the International Society for Pharmaceutical Engineering's Risk-Based Manufacturing of Pharmaceutical Products), the U.S. FDA had expressed a strong interest in a tool to identify the degree of hazard of drugs. Such a tool would allow inspectors to quickly identify those specific manufacturers, facilities, and manufacturing areas that are handling the riskiest APIs. As a result, the focus of their inspections could shift to ensure the appropriate level of control exists at the locations that present the greatest risk to patient safety. The ADE-derived toxicity scale provided a means to quickly and visually identify facilities, manufacturing lines, and equipment that handle more hazardous compounds.1 But this only indicates whether a hazardous compound is present or not and its degree of hazard. The toxicity scale by itself does not indicate how well the facility is handling that compound or removing residues of that compound. The use of the newly proposed process capability scale can provide a realistically defined measure of cleaning performance, and, when combined with the toxicity scale, can indicate the level of risk for compound carryover in shared facilities.
According to ICH Q9, the two primary principles of quality risk management are:
"The evaluation of the risk to quality should be based on scientific knowledge and ultimately link to the protection of the patient; and
The level of effort, formality, and documentation of the quality risk management process should be commensurate with the level of risk.”
Working from these principles, these scales could also be used as a guide for a facility to decide how much cleaning validation is necessary to demonstrate that a cleaning process is effective and consistent.
The authors believe that cleaning is a deserving candidate for adoption of a science- and risk-based approach. We believe that the ADE and the cleaning process capability provide the scientific justification, and the analysis using the toxicity scale and the process capability scale provide the measure of risk as formulated in ICH Q9. To summarize, the risk involved in cleaning should be evaluated through the ADE-derived toxicity scale, which informs us which products are more hazardous than others. The process capability scale informs us of the difficulty in cleaning the products to safe levels. These two scales combined inform us where our cleaning process development efforts should be focused, and they can even help us to assess the reliability of our cleaning processes, ultimately resulting in the improvement of patient safety.
The next article will discuss a new scale for detectability based on visual residue limits and maximum safe surface limits. A final article will discuss how these scales might be used together for performing cleaning FMEAs/FMECAs.
Peer Reviewers: Sarra Boujelben, Parth Desai, and Mallory DeGennaro
References:
- Walsh, A., et.al., "An ADE-Derived Scale For Assessing Product Cross-Contamination Risk In Shared Facilities," May 2017, Pharmaceutical Online, www.researchgate.net/publication/317176627_An_ADE-Derived_Scale_For_Assessing_Product_Cross-Contamination_Risk_In_Shared_Facilities
- International Conference on Harmonisation of Technical Requirements for Registration of Pharmaceuticals for Human Use, ICH Harmonised Tripartite Guideline, Quality Risk Management – Q9, Step 4, 9 November 2005, www.ich.org.
- Helsel, Dennis R., "Statistics for Censored Environmental Data Using Minitab® and R" 2012, 2nd Edition, John Wiley and Sons, ISBN 978-0-470-47988-9
- Wheeler, D., “Problems with Risk Priority Numbers – Avoiding More Numerical Jabberwocky,” Quality Digest, June 2011, www.qualitydigest.com/inside/quality-insider-article/problems-risk-priority-numbers.html
- Hubbard, D. and D. Evans, “Problems with scoring methods and ordinal scales in risk assessment.” IBM Journal of Research and Development. Volume 54, Number 3. May/June 2010
- Gilchrist, W., Modeling Failure Modes and Effects Analysis. International Journal of Quality & Reliability Management, 1993, 10 (5), 16-23.
- Waldron, Kelly, "Risk Analysis and Ordinal Risk Rating Scales - A Closer Look" Journal of Validation Technology Dec. 2015, Vol. 21 Issue 4, p11
- Cadwallader, L. C., "The Worker Exposure Failure Modes and Effects Analysis" Fusion Science and Technology Vol. 47, Issue 4, 2005
- ISPE Baseline® Guide: Risk-Based Manufacture of Pharmaceutical Products (Risk-MaPP), International Society for Pharmaceutical Engineering (ISPE), First Edition, September 2010.
About The Authors:
Andrew Walsh is president of the Center for Pharmaceutical Cleaning Innovation, a non-profit research and educational organization.
David Dolan, Ph.D., is an occupational, environmental, and quality toxicologist at Amgen Inc.
Andreas Flueckiger has been in charge of occupational health including occupational toxicology in the Roche Group for 30+ years. His department also establishes Roche's health-based limits values used in GMP cleaning.
Igor Gorsky is a senior consultant at ConcordiaValsource and a frequent speaker/writer on topics such as cleaning validation, critical utilities, process scale-up and validation, and knowledge management.
Robert Kowal is a retired cleaning validation subject matter expert (SME) for Johnson & Johnson.
Ester Lovsin Barle is head of health hazard assessment in Novartis Global HSE & BCM, where she is responsible for development of health-based exposure limits (HBELs), occupational toxicology, and patient safety-related process in support of manufacturing in Novartis globally.
Mohammad Ovais is scientific affairs manager for Xepa-Soul Pattinson (M) Sdn Bhd, Malaysia and a long-time student of cleaning validation.
Osamu Shirokizawa is a director and senior consultant of Life Scientia Limited, a pharmaceutical engineering and consultancy firm.
Kelly Waldron is a senior consultant with Valsource and a regulatory science researcher with the Pharmaceutical Regulatory Science Team at the Dublin Institute Technology.