
A New Approach For Minimizing Human Errors In Biopharmaceuticals And Medical Devices
By Mark F. Witcher, Ph.D., biopharma operations subject matter expert

Controlling human errors is one of every organization’s greatest challenges. Human errors account for a majority of failures in executing many complex activities in aviation, nuclear, and many other industries.1 The same is true for biopharmaceuticals and medical devices.
This article describes a simple and effective method for building supportive systems, processes, and environments using relational risk analysis (ReRA) that can significantly reduce the likelihood of people making mistakes. The method emphasizes making human activities successful by identifying and managing failure modes that might decrease people’s ability to accomplish assigned tasks and activities while also identifying and implementing improvement opportunities.
ReRA defines a risk as “the impact of uncertainty on the actions, activities, mechanisms, processes, and systems that produces an objective or consequence.” People are major contributors to the activities, mechanisms, and systems required to realize an objective and thus are a major part of the uncertainties that might impact achieving an objective.
Principles Of Relational Risk Analysis (ReRA)
ReRA fundamentally and profoundly changes the way risks are analyzed and managed by redefining a risk from “bad events” to “bad mechanisms that produce bad events.” ReRA models risks as sequences or networks of one or more risk mechanisms composed of the element shown in Figure 1. This basic element is the foundation for a system risk structure (SRS) describing how an initiating event passes through a sequence of risk mechanisms to result in an outcome event.2
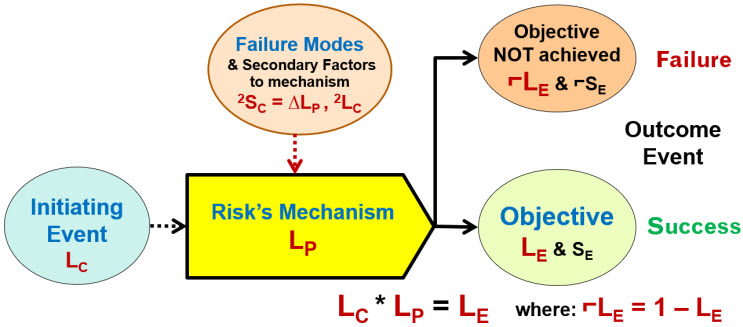
Figure 1: The ReRA model element describes an initiating input cause event (threat or opportunity) of likelihood LC that enters a risk mechanism having a likelihood of LP of propagating the initiating event to produce an output objective effect event (harm or benefit) of likelihood LE calculated as LE = LC * LP. If the objective is not achieved then a no effect event of likelihood ⌐LE, calculated as ⌐LE = 1 - LE, occurs.
The mechanism or system is the combination of people, actions, decisions, equipment, activities, or anything else that receives the input cause event and transmits or propagates it to produce an outcome effect event or objective. The risks mechanism has a baseline performance value of LP that can be estimated by the risk analysis team based on their knowledge and experience of the system, including the define, design, and qualify life cycle activities used to create the system. However, the likelihood LP can be impacted by failure modes that degrade the system’s performance by ΔLP. The system’s LP also can be modified during risk management activities by design opportunities that improve the system’s performance.
If the risk element in Figure 1 is used to describe a sequence of risk mechanisms such as a chain of procedure steps, then the likelihoods of the sequence equal the mathematical product of the mechanism’s LPs. For example, a risk describe by a sequence of three mechanisms (A, B, & C) has an overall LP = ALP * BLP * CLP.
The relationship in Figure 1 describes two fundamentally different types of risks. The first is a “harm risk” where the mechanism is used to minimize the likelihood of the consequence effect event’s occurrence. As shown in Figure 2, the objective of a harm risk mechanism is to minimize the occurrence of the harmful outcome to at least an acceptable likelihood of ≤ LH.
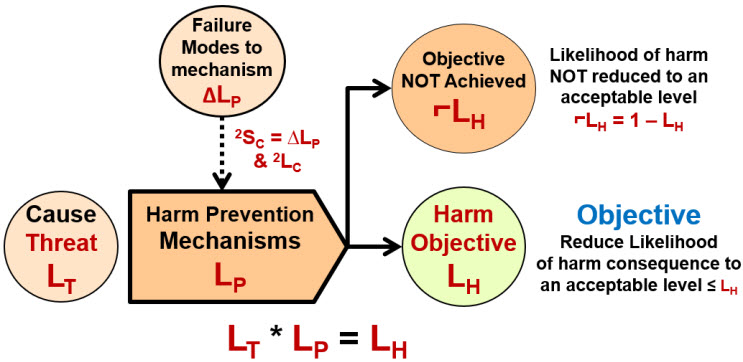
Figure 2: Harm Risk Model – An initiating cause or threat event enters the mechanism that has a likelihood of LP of resulting in a harm consequence event. The likelihood of the harm event LH occurring is calculated as LT * LP. Because the model usually describes failure rates, the likelihoods for most harm risks are generally much less than 50%.
The harm risk model can be described using Reason’s classic analogy of slices of Swiss cheese that collectively block the passage of threats that might result in harm to the risk’s subject.3 The harm risk structure is the most common visualization currently used for understanding and managing risks. Safety risks are frequently described using a harm risk model as a series of protective barriers or layers of protection designed to block the flow of a threat or hazardous situation preventing harm to the subject. 4,5 In most cases, the performance of each element in a harm risk’s mechanism are independent of the performance of the other protective layers.
The second type of risk is a “benefit risk” where the goal is to take an opportunity and maximize the likelihood of achieving the benefit. As shown in Figure 3, an initiating cause event enters a risk mechanism intended or designed to have a likelihood of at least LP of producing a beneficial objective. Most benefit risks are intentionally initiated (LC = 1), thus the likelihood of the benefit is LB = LP.
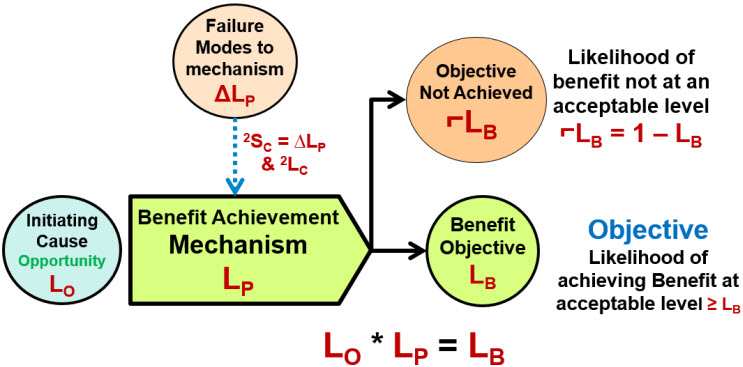
Figure 3: Benefit Risk Model – An initiating event or opportunity enters the mechanism that has a likelihood of LP of resulting in a beneficial event of likelihood LB. If the opportunity is deliberately initiated, LO = 1, then LB = LP. Because benefit risks usually model success rates, the likelihoods are usually much greater than 50%.
The author is not aware of a benefit risk model approach being described by or reasonably extrapolated from any other risk analysis method. However, the benefit risk model is a logical result of the ReRA model shown in Figure 1.
The benefit risk model is valuable for modeling a wide variety of risks that must focus on building successful systems to achieve an objective. Benefit risk models are useful for analyzing supply chains, procedures, and other risks where the mechanisms are dependent on the success of the risk’s other mechanisms in the sequence for achieving the objective.6,7 A good analogy for benefit risks is a chain where the strength of the entire chain is determined by the weakest link.
As will be described later in the article, using a benefit risk model for analyzing and managing risks of human errors may be significantly better than modeling them as harm risks attempting to prevent mistakes.
All risk outcomes, objectives, or consequences have two attributes. The first is severity or significance of impact. The significance or severity of most risk outcomes can be objectively measured quantitatively by some form of financial impact that include the value of losses or gains, avoided expenses, cost of mitigation, etc.
The event’s impact is then compared to the risk’s other attribute of likelihood of occurrence for acceptance or management. The most difficult challenge of accepting any risk event given its severity is estimating its likelihood of occurrence.
Managing A Risk’s Likelihoods
ReRA assumes that all likelihood distributions for all events are single trial Bernoulli “likelihoods.” The event either occurs (LX) or does not occur (¬LX) following the relationship LX + ¬LX = 1. ReRA also assumes that all risk mechanism LPs have the same likelihood distribution and that a mechanism does or does not propagate the input event to produce the output event. As shown in Figure 1, LE = LP * LC describes the likelihood an initiating event will flow through systems or mechanisms to a final event.
Given the high uncertainty inherent in most risks, especially those involving human activities, single-trial Bernoulli distributions provide a straightforward and effective method of analyzing, managing, and, most importantly, communicating all the required likelihoods. Very few risks have enough data and information to support estimating likelihoods beyond an order of magnitude. ReRA uses order-of-magnitude likelihood and likelihood ratings described in Table 1 for both harm and benefit risks.
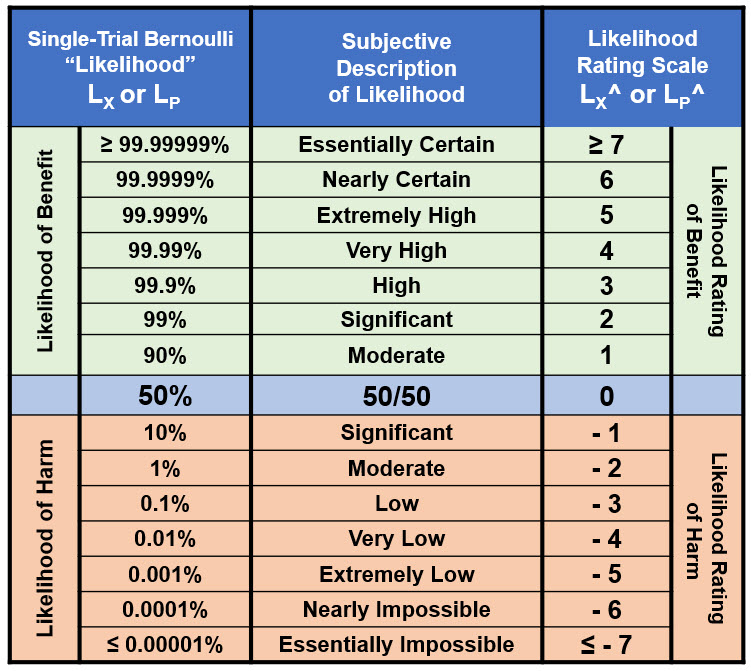
Table 1: Likelihood and likelihood rating table for quantifying ReRA model risk likelihoods. The table covers the entire range of likelihoods from essentially certain to essentially impossible for an event X’s likelihood of occurrence (LX) and a system’s likelihood of propagation LP. The table is constructed by calculating LX^ = Log10(LX) for LX < 50%, then for all LX > 50% setting LX^ = – Log10(1 – LX^). For LX = 50%, LX^ = 0. Note that LX^ for both LX = 0 and LX = 1 are undefined.
In Table 1, the LX^ rating scale is symmetric around 50% with positive ratings for likelihoods > 50% and negative values for likelihood < 50%. The likelihood relationship LX + ¬LX = 1 is equivalent to LX^ + ¬LX^ = 0, resulting in ¬LX^ = – LX^ for translating likelihood ratings between failures and successes and vice versa. A useful approximation for harm risks is for any LX ≥ 50%, set LX^ = 0, while for benefit risks, any LX ≤ 50%, set LX^ = 0.
The likelihood ratings in Table 1 provide a universal method of evaluating and communicating likelihoods. Concisely handling the likelihood of harm risks is straightforward because they are all less than 50%. For a sequence of harm risk mechanisms, the ratings LX^ = Log10(LX) means the likelihoods can be multiplied by adding the logarithmic ratings.
However, benefit risks deal with likelihoods larger than 50%, causing confusion. Evaluating benefit risks using the ratings requires using a yield approximation. For sequences of likelihoods greater than 90%, the product of a sequence of mechanisms can usually be approximated as the lowest value (the weakest link) in the sequence. For a more rigorous analysis of benefit risks or when harm risks contain probabilities ≥ 50% or benefit risk have likelihoods ≤ 50%, likelihoods should be used directly.
If the event is intentionally initiated, then LC = 1 or LC^ = 0. Such would be the case if a procedure was initiated to achieve the benefit of completing the procedure or a supply chain initiated to deliver some materials.
Humans are very fragile systems subject to considerable sudden changes due to a wide variety of failure modes. Even people with long histories of success may suddenly become less successful for many difficult to predict reasons (failure modes).
Managing The Likelihood Of Human Errors
As shown in Figure 3, the acceptable success rate rating for a risk mechanism is LP^ when a benefit risk model is used. The success rate is impacted by failure modes that decrease LP^ and modifications or improvement opportunities that increase LP^. A quick table for thinking about and approximating the change in LP^ for a benefit risk from failure modes or improvement opportunities is shown in Table 2.
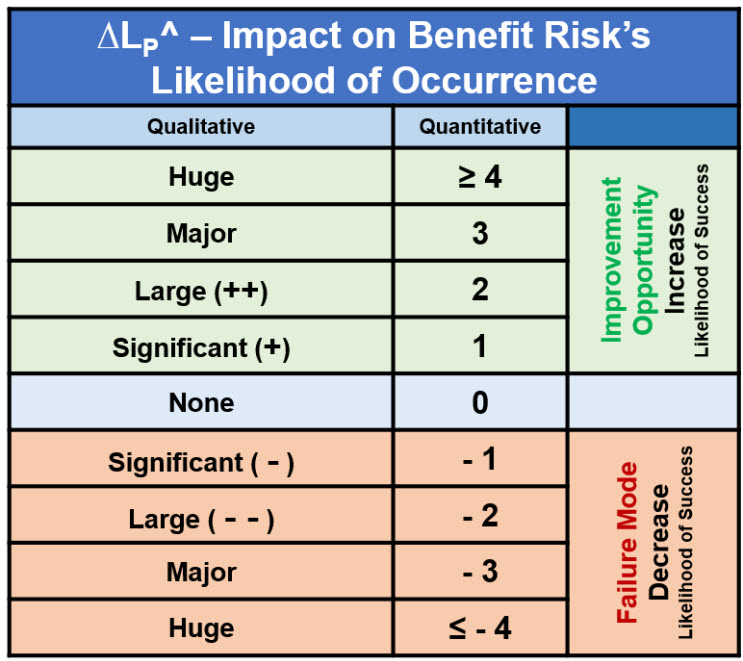
Table 2: Impact significance ∆LP^ of a secondary factor on a ReRA benefit risk mechanism’s success rate can be approximated by LP^ + Sum(∆LP^). The table can be used subjectively to adjust the LP^ based on a qualitative estimate using one or more minus signs for a decrease or one or more plus signs for an increase in LP^. A more quantitative estimate can be described using the ∆LP^ in the middle column. A more rigorous approach can evaluate the impact of the secondary factor on the primary system as 2SC^ = ∆LP^ and then adjusted by the likelihood of the secondary factor occurring 2LC.
In the absence of a significant amount of data, evaluating the impact of various failure modes is a subjective estimate made by the risk analysis team. Given the significance of the failure mode’s impact relative to the normal primary system’s LP^, the analysis team can document the failure mode’s significance in a risk register and then identify how the failure mode can be controlled to an acceptable level.
Positive Approach For Controlling Human Errors
When it comes to describing human errors, Reason’s harm risk model of slices of Swiss cheese is perhaps unfortunate. People are better managed using a positive approach. Equipment has failure rates, while the performance of people is more effectively described using success rates. Instead of controlling human failure, a better approach would be having the goal of a risk analysis increasing the success rates of human activities by using a benefit risk model.
Depending on the level of rigor required given the significance of the primary risk’s objective, two basic strategies can be used for analyzing, managing, and communicating the risk.
Managing the primary risk mechanism
The first method is to analyze the impact of secondary factors directly when estimating the success rate LP^ of the primary risk, as shown in Figure 4.
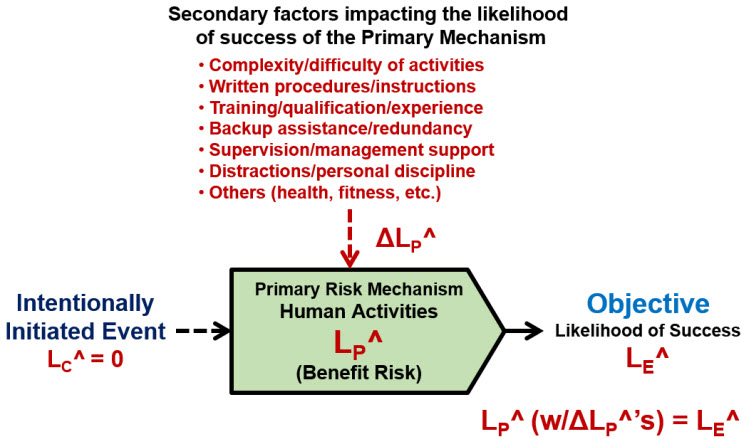
Figure 4: SRS for a primary risk mechanism describing human activities that might be impacted by secondary factors. Each factor is identified and the risk mechanism’s LP^ is evaluated and estimated based on the cumulative impact of all the human failure modes and improvement opportunities. The risk is managed by changing the primary risk mechanism directly to decrease the impact of failure modes or implement improvement opportunities.
The list of secondary factors for human activities is very large and may vary widely from one person to another. The list shown in Figure 4 contains some of the more obvious factors that can be considered when evaluating the likelihood of success LP^ of the human contribution to the mechanism’s success. If LP^ is not acceptable in the view of the analysis team, then the primary mechanism can be modified to improve its success rate by identifying and controlling the likely significant failure modes or identifying and implementing important opportunities.
The purpose of the analysis is NOT to generate rating values but to aid in identifying the significant secondary factors. The rating values are simply a method of communicating and discussing the relative significance of each and to evaluate possible changes of the risk’s mechanisms between the risk analysis team members. The ratings documented in a risk register accompanied by a rationale can then be used to convey their consensus estimates to outside groups, including auditors, management, and regulatory agencies.
For important failure modes or significant improvement opportunities, the more robust approach described below can be used.
Managing secondary risk mechanisms
A more rigorous risk analysis of failure modes is shown in Figure 5, which identifies specific secondary risk systems that result in important secondary factors to the risk’s primary mechanism.
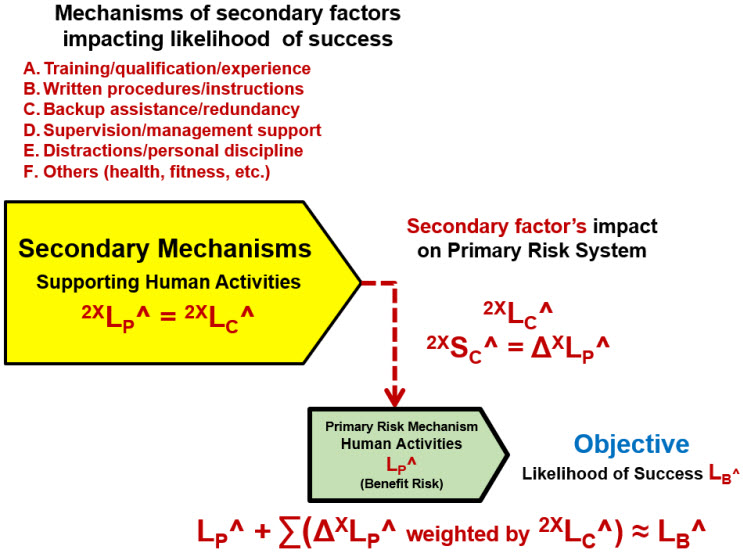
Figure 5: Evaluating secondary risk mechanisms for their impact on human performance. The secondary mechanism produces failure mode events or situations to the primary risk mechanism of severity 2XSC^ = ∆LP^ with a likelihood of occurrence 2XLP^ = 2XLC^. By reducing 2XLC^, the likelihood of the failure mode occurring, the likelihood of the primary risk system failing can be improved.
The approach identifies and analyses secondary mechanisms or systems that either produce failure mode events or secondary improvement events for improving the primary system’s performance. Secondary systems follow the SRS approach shown in Figure 1, except the significance of the secondary risk’s output event is a change in the primary risk system’s LP^. The likelihood of the failure mode occurring to the primary system is 2LC^. The purpose of the analysis is to identify, quantify, manage, and document secondary factors in a risk register using Table 2 to decrease the likelihood of failure modes events or situations occurring to the primary system by decreasing 2XLC^.
For example, a training program would be a secondary system that has a likelihood of 2ALP of successfully training operators. A systematic review of the training program might identify failure modes and improvement opportunities, ultimately reducing the chance of decreased success of the primary risk mechanism. For example, if a training program is underfunded or adversely impacted by changes, the likelihood of it successfully training operators can be negatively impacted.
The analysis of each secondary system can be documented in a separate risk register. The analysis team can document the values estimated and provide a rationale for those values. Again, the purpose is not to provide ratings but to identify the failure modes and improvement opportunities for the secondary systems to ultimately improve the performance of the primary risk’s mechanism.
Summary
The primary value of the ReRA approach is not the rating values estimated by the analysis team but, rather, the judgements rendered making the estimates. The simplified rating system provides a concise method for communicating the likelihood estimates and justifying why the team believes the risk is acceptable or not. If the risk relationship is not acceptable, then the team’s rationales for making changes to control failure modes or implementing improvements can be concisely and efficiently communicated in the risk register for discussion and presentation to auditors, management, and regulatory agencies. Each analysis should have an annotated SRS and a risk register (RR) describing the team’s estimates of LC^, LP^, 2LP^, 2LC^, etc., along with appropriate rationales and discussion of each risk’s primary and secondary risk mechanisms.
Future Development
ReRA is in its early stages of development. The eventual path of ReRA will likely be to bridge the conceptual gap between risk and reliability analysis. The use of single-trial Bernoulli distributions is a quick approximation for analyzing many risks. If sufficient data and understanding of the risk’s SRS is available, there may be adequate justification for using a more sophisticated likelihood distribution, such as a Weibull distribution found in the reliability analysis literature.8 The current ReRA approach is simply a start to eventually creating more robust risk analysis approaches for risks that justify a more rigorous analysis.
References
- French, S., et.al., Human Reliability Analysis: a critique and review for managers; Safety Science, vol 49, issue 6, July 2011, pp753-763.
- Witcher, M., Relational Risk Analysis for The BioPharma Industry, Bioprocess Online, January 29, 2024. https://www.bioprocessonline.com/doc/relational-risk-analysis-for-the-bio-pharma-industry-0001
- Reason, J., Managing the Risks of Organizational Accidents, Ashgate Publishing, 1997.
- Guglielmi, D., et. al., Integrating Human Barriers in Human Reliability Analysis: New Model for the Energy Sector, Int. J. of Env. Res. & Pub. Health, 2022.
- Witcher, M., How to Evaluate & Manage Safety Risks in Biopharma, May 2, 2022. https://www.bioprocessonline.com/doc/how-to-evaluate-manage-safety-risks-in-biopharma-0001
- Witcher, M., Using Relational Risk Analysis To Control Procedure Failures, Bioprocess Online, April 5, 2024. https://www.bioprocessonline.com/doc/using-relational-risk-analysis-to-control-procedure-failures-in-the-bio-pharma-medical-device-industry-0001
- Witcher, M., Managing Supply Chain Risks Using Relational Risk Analysis, April 5, 2024.
- Singpurwalla, N., Reliability and Risk – A Bayesian Perspective, Wiley & Sons, 2006
About The Author:
 Mark F. Witcher, Ph.D., has over 35 years of experience in biopharmaceuticals. He currently consults with a few select companies. Previously, he worked for several engineering companies on feasibility and conceptual design studies for advanced biopharmaceutical manufacturing facilities. Witcher was an independent consultant in the biopharmaceutical industry for 15 years on operational issues related to: product and process development, strategic business development, clinical and commercial manufacturing, tech transfer, and facility design. He also taught courses on process validation for ISPE. He was previously the SVP of manufacturing operations for Covance Biotechnology Services, where he was responsible for the design, construction, start-up, and operation of their $50-million contract manufacturing facility. Prior to joining Covance, Witcher was VP of manufacturing at Amgen. You can reach him at witchermf@aol.com or on LinkedIn (linkedin.com/in/mark-witcher).