
Relational Risk Analysis For The Bio/Pharma Industry
By Mark F. Witcher, Ph.D., biopharma operations subject matter expert

Successfully developing and manufacturing biopharmaceuticals depends on identifying, analyzing, and managing a wide variety of risks. This article presents a novel alternative risk analysis approach that provides a simple, easy, and effective method for quickly and efficiently modeling and analyzing any risk, including biopharmaceutical, pharmaceutical, and medical device risks. Additional articles will explain how this approach can be used for managing risks associated with procedures, human errors, supply chains, cross contamination, and other risks.
Essentially every current risk analysis method approaches risks as primarily undesirable events. Heat maps, RPN (risk priority number), and FMEA (failure mode & effect analysis) describe a risk as an event focusing mostly on the risk event's severity while treating the event's probability of occurrence as a scaled weighing factor of severity (i.e., the more likely it is to occur, the higher its severity). Other risk analysis methods such as FTA (fault tree analysis) and HACCP (hazard analysis and critical control point) analysis describe the flow of risk events but do not provide a useful model for estimating the probability of occurrence for the risk's events. None of the existing risk analysis methods, with the possible exception of AIChE's LOPA (layers of protection analysis), focus on the risk's mechanism of action and the probability it will propagate a cause event to produce an effect event.
The approach described in this article switches the focus of a risk analysis from the risk's events to the risk's mechanism of action, described as a "system" for evaluating a risk event's probability of occurrence. In order to identify and analyze a risk's mechanism of action, risks must be viewed as a relationship between events that are connected by a system. In other words, risks have three primary elements: a cause event, a connecting mechanism or system, and an effect event that form a probabilistic relationship where the probability of the effect event is equal to the mathematical product of the probability of the cause event occurring and the probability of the risk's mechanism propagating the cause.
Relational risk analysis (ReRA) models risks as relationships between events. ReRA structures the relationships to describe the flow of risk events for estimating their probability of occurrence for analysis and management. This article provides a very brief introduction to the principles of ReRA.
ReRA is based on defining all risks as probabilistic cause event–system–effect event relationships described in Figure 1.
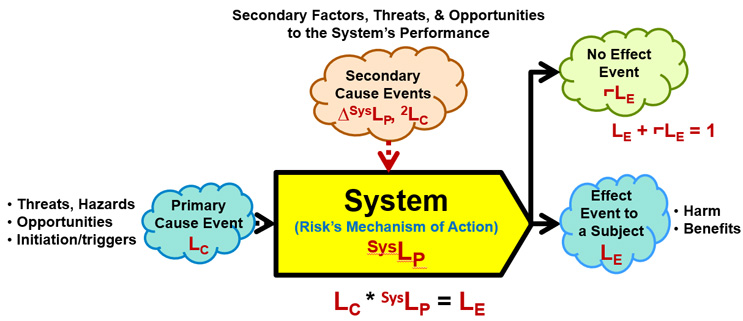
Figure 1: A Risk – An input cause event to a mechanism called a system that propagates the cause event to produce either an output effect event or a non-event using the following symbols:
- LC – Probability of the cause event occurring.
- LE – Probability of the effect event occurring.
- ⌐LE – Probability of the effect event not occurring.
- SysLP – Probability of the system propagating the cause to produce the effect.
- ΔSysLP – The amount SysLP is changed by a secondary cause event with a likelihood of occurrence of 2LC.
The probability of the effect event occurring LE is calculated as the mathematical product of SysLP and LC. If the effect event does not occur, a no effect event with a probability of 1 – LE occurs.
The risk in Figure 1 has the following elements:
- Cause event – An input initiating event usually described as a threat or opportunity of probability LC that comes from one or more prior risk systems that may or may not be included in the analysis. The cause may be intentionally initiated (LC = 1) to achieve an objective. The cause event may be a hazard or prevailing condition or situation that also has an LC = 1.
- System – The risk's mechanism of action that includes any intended or actual actions or activities by which the initiating cause event is propagated to produce the effect event or consequence. The system can include any combination of people, equipment, activities, plans, or sequences of actions. The probability of the system propagating the cause is described as SysLP.
- Secondary cause events – Various factors, threats, and opportunities that impact the performance of the system by changing SysLP. A secondary cause event cannot cause an effect event but can make the effect event significantly more or less likely to occur. The secondary cause event can be the consequence of a secondary cause–system–effect risk.
- Effect event – An event described as either a harm or benefit event of a severity or significance of SE and a probability of LE. The probability of the effect event occurring is LC * SysLP = LE. However, if the effect event does not occur, then a no-effect event of probability ⌐LE = 1 – LE occurs. Either the effect or the no-effect event may be a cause event to a subsequent risk that may or may not be included in the analysis. In some cases, the occurrence of the no-effect event may be significantly more important than the effect event's occurrence because it may be a cause event to subsequent risks.
- Subject – The entity, individual, group, enterprise, or system impacted by the effect event.
Risk events are characterized by two attributes – significance or severity and probability of occurrence. The severity of a risk event is usually obvious. Severity normally falls into two categories: not significant enough to worry about or significant enough to analyze and manage as appropriate. A convenient 10-point logarithmic Sc^ rating scale that covers the entire range from 0 ($1) to 9 ($1 billion) provides a simple integer rating scale SC^ from 0 to 9.
Because a risk's model describing future events and actions are inherently uncertain, risk probabilities can be sufficiently described using a single trial Bernoulli distribution where the probability value simply describes whether the event or action occurs or does not occur for a single attempt or trial or over a defined time period as a frequency. For managing, understanding, and describing risks, the probabilities shown in Table 1 are sufficient for concisely describing probabilities over the entire range from impossible (0%) to certain (100%).

Table 1: The range of probabilities from essentially certain to essentially impossible for an event X's probability of occurrence (LX) and a system's probability of propagation SysLP. A rating scale LX^ and SysLP^ is also included. The ranges can be extended in either direction as needed.
The integer rating scale shown in the right column provides a clear, universal method for concisely communicating a risk's probabilities. The straightforward rating scale between 7 and - 7 spans the probabilities of 0.9999999 (essentially certain) to 0.0000001 (essentially impossible) that can be used for describing SysLP, LX and ¬LX. The simple order-of-magnitude rating scale is created by:
- for probabilities < 50%, LX^ = Log10 (LX)
- for LX = 50%, LX^ = 0
- for probabilities > 50%, LX^ = the negative value of the Log10 (1 – LX)
Note that the LX^ rating scale is symmetric around 50% with positive ratings for probabilities > 50% and negative for probabilities < 50%. The probabilistic relationship LX + ¬LX = 1 results in a corresponding LX^ + ¬LX^ = 0 rating relationship resulting in ¬LX^ = – LX^ for translating likelihood ratings between harm (or failures) and benefit (or success) risks and vice versa.
The cause-effect relationship shown in Figure 1 can be separated into "harm risks" where the system attempts to prevent the harm by having a low probability of propagation and "benefit risks" where the system must maximize the probability of achieving the benefit by having a high probability of propagation. For harm risks, the systems can be viewed as layers of protection. Examples of harm risks are safety and cross contamination.
Benefit risks can be viewed as chains that are as strong as their weakest link. Benefit risks also can be viewed in terms of the probability of achieving the benefit as a yield function of the system's ability to maximize the probability of propagating a cause into benefits. Examples of benefit risks are procedures and supply chains. While all risks are causal relationships, dividing risk into harm or benefit risks prevents having to deal with double negatives from mismatching the system's probability goal and the probability goal of the final objective.
The probability rating system provides a very convenient method of calculating likelihoods in complex risk structures. Remembering that the rating scale is only an order-of-magnitude estimate, the scale simplifies depending on whether the risk is a harm or benefit risk. When using ratings for calculating harm risk, all likelihoods ≥ 50% get a rating value of 0. When calculating a benefit risk, all likelihoods ≤ 50% get a rating value of 0.
The definition of a risk shown in Figure 1 provides a method of describing both very simple risks as well as providing a building block for describing complex risks. Complex risks are described as a sequence or network of risks that define paths from one or more initiating events to one or more final consequence events. These paths form a system risk structure (SRS) that describes one or more risk sequences from a single threat or opportunity cause event to a single harm or benefit effect event that can be evaluated in terms of the probability of the cause event resulting in the effect event.
Analyzing and evaluating SRSs based on Figure 1 largely reduces the risk analysis problem to estimating the probabilities of the various systems propagating events and identifying the secondary factors that might influence the performance of the risk system, propagating a cause into an effect. Managing risks becomes an exercise in modifying or designing systems that provide the necessary probabilities for controlling the effect events to their acceptable probability of occurrence.
If the secondary factor cause events shown in Figure 1 are similarly treated as cause-system-effect risks, they can be modeled as secondary cause events that impact the performance SysLP of the primary risk system. Secondary risks have a severity of ΔSysLP and a likelihood of occurrence of 2LC. Including secondary risks within the SRS creates network elements for the primary risk sequences useful for modeling complex risks that include secondary risks. While secondary risks cannot cause the primary cause event, they can profoundly impact the probability of the primary effect event's occurrence.
About The Author:
 Mark F. Witcher, Ph.D., has over 35 years of experience in biopharmaceuticals. He currently consults with a few select companies. Previously, he worked for several engineering companies on feasibility and conceptual design studies for advanced biopharmaceutical manufacturing facilities. Witcher was an independent consultant in the biopharmaceutical industry for 15 years on operational issues related to: product and process development, strategic business development, clinical and commercial manufacturing, tech transfer, and facility design. He also taught courses on process validation for ISPE. He was previously the SVP of manufacturing operations for Covance Biotechnology Services, where he was responsible for the design, construction, start-up, and operation of their $50-million contract manufacturing facility. Prior to joining Covance, Witcher was VP of manufacturing at Amgen. You can reach him at witchermf@aol.com or on LinkedIn (linkedin.com/in/mark-witcher).