
How To (Better) Identify And Analyze Manufacturing Trends In Your GxP Organization
By Ben Locwin, Ph.D.
 Part 1 of Identifying And Resolving Errors, Defects, And Problems Within Your Organization — a five-part series on operationalizing proper improvement techniques
It has been said that better-performing organizations have fewer issues. This is false. What better-performing organizations have going for them is the fact that they correctly identify — and respond to — the problems that they do have. When we tried to “automotive-ize” Big Pharma in the early 2000s, many of the tools that worked within the Toyota Production System (and similar systems implemented at Honda, Hyundai, etc.) were misused in pharmaceutical manufacturing. Within pharma, problems were identified, catalogued, catalogued, and then catalogued some more. In contrast, when an issue is found in real-time in a well-operating, high-performing facility, it is most often corrected immediately. This means without needing a governing committee to resolve the error. As Ross Perot said, “If you see a snake, kill it — don’t appoint a committee on snakes.”1
(Note: You'll begin to understand the relationship between the picture above and your quest for the quantitative truth by the end of this article.)
There Have Been Many Articles On Identifying Deviation Trends … Why This One?
This gets directly at your tacit question, “Why should I read any further than this line?” It’s a fair question because, as with anything in life, you’re either “wasting” time or you’re “spending” it. I was asked to write this article series to fill a need in the industry: There are lots of tools, lots of ideas, but not a well-thought-out plan that’s actually operationalizable to identify and eliminate errors.
Often, what I see is pharma companies paralyzed by governing regulations. Every corrective and preventive action (CAPA) is thought to require a documentation trail, approval to implement and correct, and so forth. While this is true, the documentation trail doesn’t need to be prohibitively complex in order to fulfill its need to describe the problem and its resolution. The symptom — and lagging indicator2 — that shows we continue to do this wrong is the ubiquity and size of quality documentation queues (deviation backlog, CAPA backlog, change control backlog, etc.). If problems were properly identified and resolved, the deviation queue at any average company at any particular time would consist simply of those that are works-in-progress (WIPs) conforming to Little’s Law. In practice, this would look like single-digit to tens of deviations (or CAPA, change controls, etc.) open at any one time. So let’s get to work….
How To Identify Trends
You can’t identify your manufacturing trends if you don’t know what to look for. So first, what IS a trend? In order to enhance your understanding and prime you for visual detection of trends in your organization, let’s look at a couple of examples.
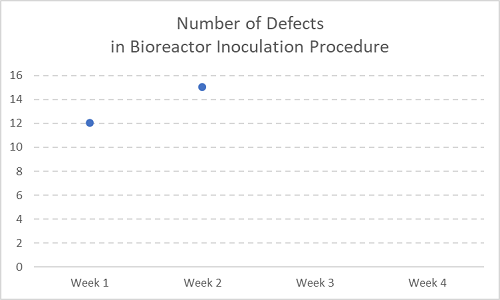
Figure 1
Let’s say the chart above is recording number of defects (errors, deviations) over time — in this case, two consecutive weeks within a month, with the second two weeks still to acquire more deviations.
In this case, you may hear things like, “Why have we seen an increase in errors here? I expect resolution ASAP.” Hint: NOT a trend. STOP doing things with these.
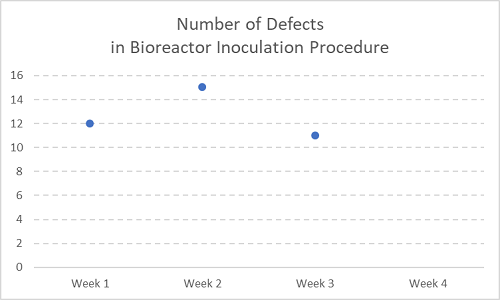
Figure 2
Now with the next week’s data (Week 3) added. Still not a trend yet.
When you see sparse data as the catalyst for resource-intensive activities, please respond with the following quotes:
“Two points do not make a trend.” In fact, “Neither, arguably, do three points!”
Trends are accumulated over time by measuring properly and also by ensuring that you’re measuring the same way at each point in time. Otherwise, the only trend you think you see is different people measuring something in different ways. (The only trend there is the systematic bias trend of human participation within a multivariate, evolving system.)
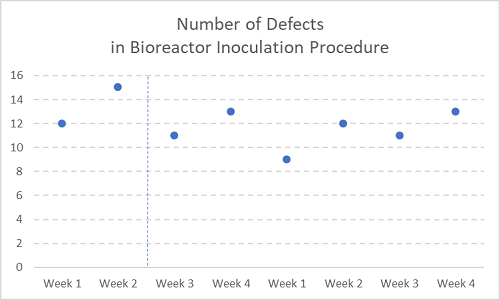
Figure 3
Now with two months’ (eight weeks’) worth of defect measurements.
See, there was never any reason to chase after a seemingly dramatic spike in issues — which actually turned out to be no spike at all.
In smaller companies, or when measuring something of small sample size in any company, it sure is tempting to take a snapshot of a particular activity and escalate it ad absurdum (see Figures 1 and 2 above again). A snapshot is a metric of one or two points, usually taken weekly, which unnecessarily mobilizes resources and increases the stress level of the site, with no appreciable long-term improvement in quality or cost control.
A snapshot is not a trend; nor is it an invitation to act. This is commonly seen and heard within organizations as something like, “Two deviations have gone overdue … Fix it!!”
Why? Perhaps your system is designed perfectly to produce a mean deviation closure time of 47 days, and your target is set at 30 days. Any that you’ve closed at the company below 30 days have been improbable, either the result of throwing undue resources at them, or due to statistical variation. So there’s really no need to panic … your system’s design led to that outcome. If you want a stable deviation process that closes in 30 days or less, every time, you need a reliable system — not castigating emails sent to functional areas or Quality staff.
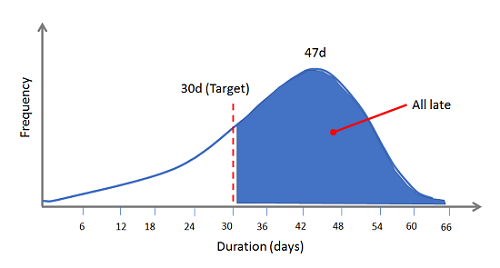
Figure 4
What to do starting tomorrow: Stop snapshotting and acting upon the snapshots. You are your own worst enemy in these cases. Snapshot metrics are garbage.
So What’s A Real Trend?
Simply, trends are those items or issues that have stable outputs, and these outputs exceed acceptable or desirable limits.
For example, let’s say you have a fairly consistent trend issue of “number of missing batch record entries found at Level 2 (QA) review.” Try to move these “findings” backward in the process. This might mean evaluating the process of Level 1 review (within Manufacturing) to see why they are escaping detection there. Then, develop a method to catch them in as close to real-time as possible during the Level 1 review. But you’re not finished yet … Then challenge yourself and your organization to get better at manufacturing operations by eliminating the issue through the investigation of the issue and identification of the root causes of errors in the batch records. And then fix them (by redesign of the batch records, as an example).
What to do starting the day after tomorrow: Interrogate your company’s deviation system (or discrepancy reports, variances, notes-to-file, etc.) and bin (categorize) them into common themes. Have many instances of excipient problems? Missing certificates of analysis (CoAs) for raw materials? Failed product identification testing? Whatever your site’s issues are will drive the need for further investigation, assessment, and resolution plans. Now, if you don’t really intend to solve (or resolve) these issues — and they’ll just form the basis for another useless list — go no further than this point.
If you choose the smart path of solving (or resolving) those things that matter most, congratulations — this article series is for you. As for the rest of you, you might as well read the rest of the series anyway since you’ve gotten this far. It will at least make you keenly aware of the chaos around you. That alone is basically like choosing the red pill over the blue one.3
The next article in this series explains the fishbone diagram, one of the most broadly applicable and durable root cause analysis tools to investigate the quality of your manufacturing processes.
Notes:
- Surprisingly enough, U.S. businessman and politician Ross Perot opined this circa 1988, and while I don’t condone the strict message, the point is an incredibly salient one. Here’s the full quote leading up to the aforementioned punchline: “At GM, if you see a snake, the first thing you do is go hire a consultant on snakes. Then you get a committee on snakes, and then you discuss it for a couple of years.” This is pretty much the same chain of events at every big pharma company.
- Lagging Indicators are really pretty terrible measurements to base activities upon. Anybody can concoct a narrative to fit a data pattern a posteriori. A subtle art here (that’s really science) is to identify and develop leading indicators that are strongly correlated with downstream (i.e., later in time) performance. Great-looking leading indicators should mean great business performance will result.
- From The Matrix (1999): “You take the blue pill, the story ends. You wake up in your bed and believe whatever you want to believe. You take the red pill, you stay in Wonderland, and I show you how deep the rabbit hole goes.”
About The Author:
 Ben Locwin, Ph.D., MBA, M.S., is a pharma executive and a member of several advisory boards and boards of directors across the industry and was the former president of a healthcare and pharma consulting organization. He created many of the frameworks for risk management currently in use within the industry and has worked across the drug life cycle from early phase to commercial manufacturing and marketing (GLP, GCP, GVP, GMP). He frequently keynotes events and conferences on these current topics. Connect with him on LinkedIn and follow him on Twitter.