
Why Dilution Gets Tricky: The Role Of Measurement Variability
By Ramakrishnan Natesan, Jenil Patel, Neeraj J. Agrawal — Process Development, Amgen Inc.

Dilution of pharmaceutical ingredients is a fundamental operation in biopharmaceutical manufacturing, used in applications ranging from buffer preparation to converting high-concentration drug substance (DS) into lower-concentration drug product (DP). It is also routinely performed during sample preparation for analytical testing. Despite its widespread use, dilution is often treated as a straightforward calculation based on measured concentration values.
In practice, the accuracy of the calculated dilution depends on the underlying measurement accuracy, while batch-to-batch consistency depends on measurement precision. Measurement precision is commonly expressed as the coefficient of variation:
CV = (standard deviation/mean) *100%.
The coefficient of variation is also known as the relative standard deviation. Protein concentration is commonly measured using a variety of methods, including fixed‑pathlength UV methods and variable-pathlength approaches. These methods utilize measurements of UV light absorbance by aromatic amino acids to compute protein concentration using the Beer-Lambert law. For clean samples, absorbance-based assays often achieve intra-assay precision of ≤3% CV, which corresponds to a standard deviation of up to 4.5 mg/mL for a 150 mg/mL sample.
While this level of variability is often considered acceptable, its impact on downstream dilution accuracy is sometimes overlooked. Because dilution calculations rely on measured, not true, concentration values, any measurement error directly propagates into the final formulated concentration. This raises an important question for manufacturing and process development: how does uncertainty in protein concentration measurement influence the final product strength?
In this article, we examine how analytical variability affects dilution outcomes. Using a statistical framework, we quantify the impact of measurement uncertainty on final concentration for a single-step process and highlight implications for process consistency and control.
How Measurement Uncertainty Affects Dilution Calculations
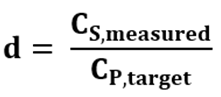
To illustrate how measurement variability impacts dilution outcomes, consider a single-step dilution where a drug substance with true concentration CS,true is diluted to a drug product with target concentration CP,target. In practice, CS,true is not known and we rely on an experimentally measured value that inherently contains some level of noise. In its simplest form, the measured concentration, CS,measured, is given by CS,measured = N(CS,true,σ2), where N is a Gaussian distribution centered at CS,true with a standard deviation of σ. The assumption of normality is valid when measurement results are only influenced by a random noise. The estimated dilution factor, d, for a specific measurement is then computed as:
Eqn. 1
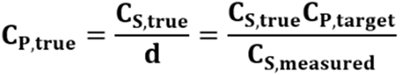
The final formulated concentration CP,true is related to the measured concentration as:
Eqn. 2
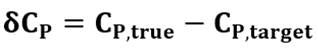
In simple terms, the dilution calculation in Eqn. 1 is based on the measured concentration rather than the true concentration. As a result, any measurement error in CS,measured directly propagates to the final formulated concentration CP,true. For example, overestimation of the starting concentration will result in excessive dilution, yielding a lower-than-target final concentration. Conversely, underestimation of the initial concentration results in an over-concentrated product. This difference between the final formulated concentration and the target concentration (δCP) can be expressed as:
Eqn. 3
The relative difference between the formulated and target concentrations is then given by:
Eqn. 4
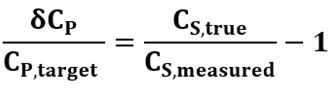
This relation shows that, under the assumptions of the model, the relative variability in formulated concentration is governed by measurement error in CS,measured. Figure 1(a) highlights how this measurement error (for CV=3%) is nonlinearly related to the corresponding deviations in CP,true, as described by Eqn. 4. As expected, when the measured concentration is close to the true concentration (i.e., CS,measured ≈ CS,true) the formulated concentration is close to its target value (i.e., CP,true ≈ CP,target). However, under- and overestimated values of CS,measured compared to CS,true even by the same amount leads to slightly different outcomes for CP,true. For example, overestimation of CS,measured by 25 mg/mL decreases the formulated concentration by 14.3%, while underestimation of CS,measured by the same 25 mg/mL increases formulated concentration by 20%. This asymmetry grows with increasing error, underscoring the value of improving measurement precision.
While increasing the number of measurement replicates can reduce uncertainty, it cannot eliminate it entirely due to practical constraints such as time, cost, and sample availability. As a result, some degree of variability is unavoidable, making it essential to understand how measurement uncertainty translates into variability in the final product.
This framework highlights a key point: dilution accuracy is fundamentally limited by measurement precision of the starting concentration, CS,measured. Even when no other sources of variability are considered during the dilution operations, analytical variability alone can drive deviations from the intended target concentration.
Analysis Of Single-Step Dilution
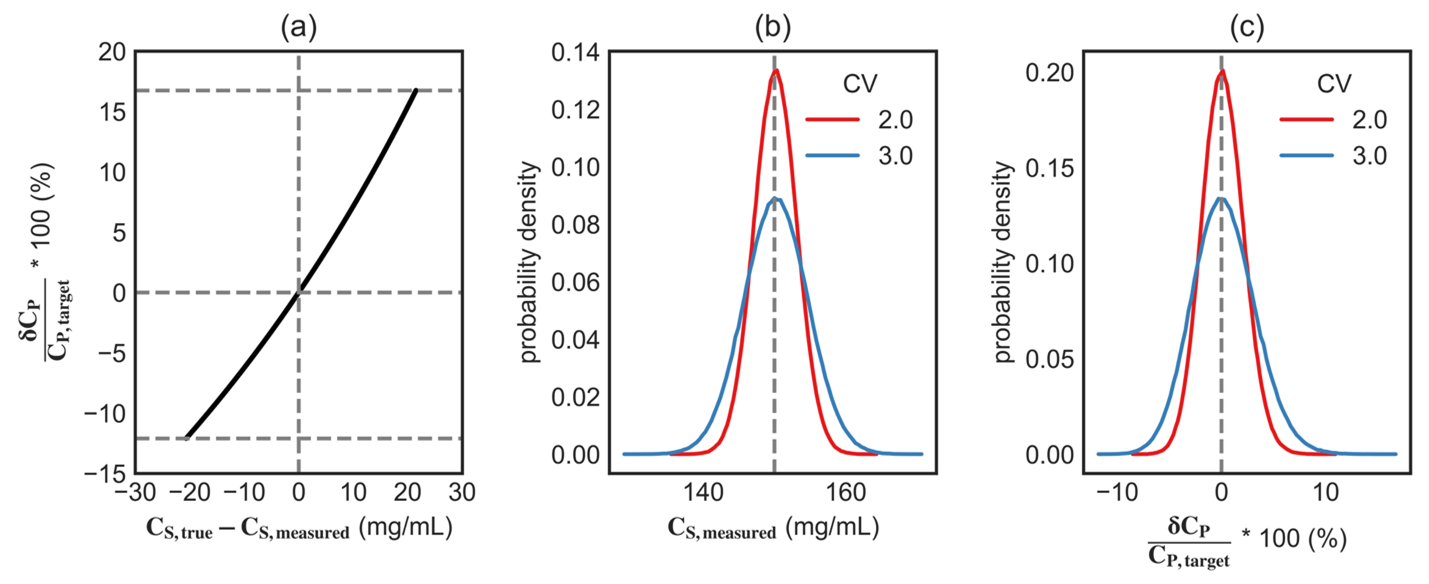
Figure 1: Distributions of CS,measured for 106 samples drawn from a Gaussian distribution with mean CS,true = 150 mg/mL and CV = 2%-3%. (a) Plot of Eqn. 4 showing the relation between the error in the measuring concentration of drug substance and the relative deviation in the formulated concentration. (b) Symmetric Gaussian distribution for CS,measured and (c) the corresponding right-skewed distribution for the measurement uncertainty (δCP/CP,target).

We first consider a single-step dilution in which the drug substance is diluted directly to the target drug product concentration. This represents the simplest and most commonly assumed dilution scenario in practice. Figure 1(b) and (c) show the results of this hypothetical experiment where we measure CS,measured for a drug substance with true concentration CS,true = 150 mg/mL using an experimental assay with coefficient of variation between 2% and 3%. For simplicity, we will assume that the assay is free of any systematic bias (e.g., variability in extinction coefficient, pathlength drift, instrument calibration, reference material misassignment, etc.) and experimental measurements follow a Gaussian distribution centered around CS,true and standard deviation σ. It should be noted that presence of any such inherent bias would not only influence the CV of the measurements but could also systematically shift the mean.
Figure 1(b) shows the probability distribution for the measured values of CS,measured, which as expected follows a Gaussian distribution. The resulting distribution of relative deviation in formulated concentration is asymmetric and right skewed, with its mean near zero; see Figure 1(c), implying that the final formulated concentration has slightly higher probability of positive deviations, while the mean remains close to the target. This asymmetry arises from the nonlinear relationship between the measured concentration, CS,measured, and the calculated dilution outcome. In practical terms, equal over- and underestimation of the starting concentration does not produce equal and opposite deviations in the final formulated product, CP,true. As a result, analytical variability introduces not only spread but also slight asymmetry, and potentially a small shift in the mean, in the distribution of formulated concentrations, CP,true.
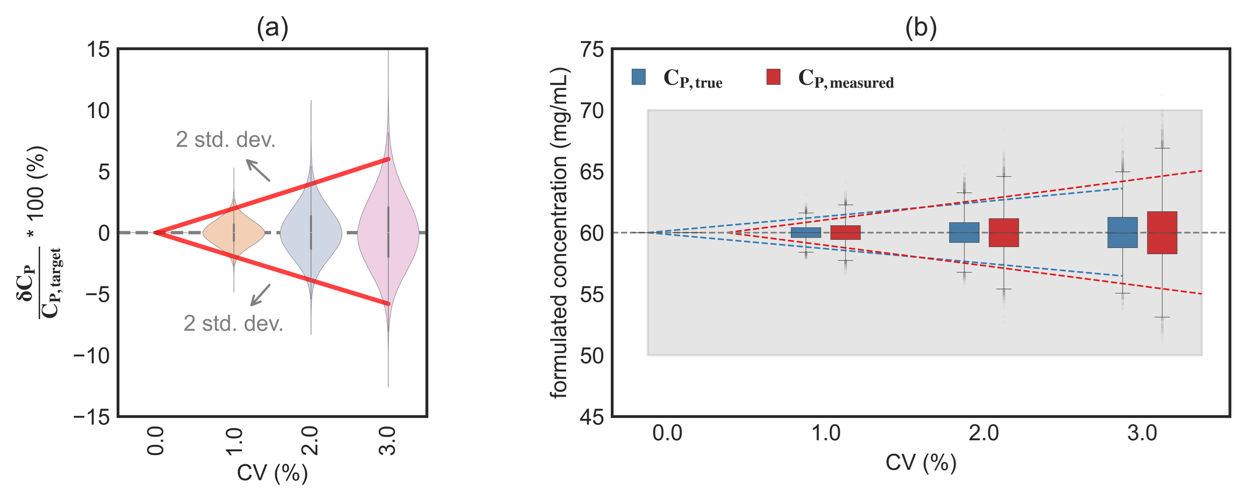
Figure 2: (a) Range of positive and negative deviations for δCP/CP,target for CV in the range 0%-3%. The solid lines represent the approximate 95% interval of the simulated distribution (roughly ±2 standard deviations). (b) Boxplot of the formulated concentration CP,true and its corresponding measured values CP,measured. The colored dotted lines denote 2 standard deviations for each data set.
Figure 2(a) shows the estimated spread in CP,true for a chosen target concentration CP,target = 60 mg/mL (requiring ∼2.5-fold dilution). Even at a modest assay variability of 3%, the final concentration within ±2 standard deviation ranges from 57 to 65 mg/mL as shown in Figure 2(b). The deviation in formulated concentration increases nonlinearly with assay variability, clearly demonstrating how noise in concentration measurements broadens the distribution of the resulting formulated concentration and influences the final formulated concentration of the drug product.
In practice, formulated concentration is remeasured using an analytical method that introduces additional measurement noise. As a result, the measured final formulated concentration, CP,measured, has a much wider spread that reflects both the variability introduced during dilution and the uncertainty of the measurement itself.
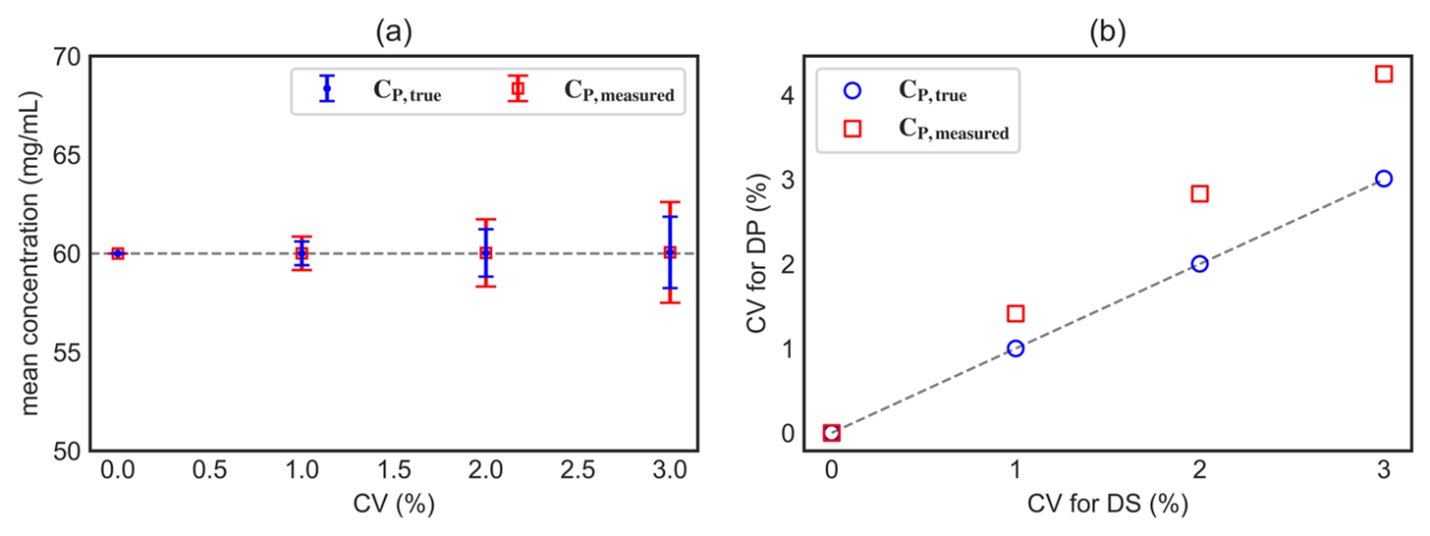
Figure 3: (a) Symbols denote the batch averaged means for the formulated concentration CP,true and measured concentration CP,measured and the error bars denote the corresponding standard deviations. Here, we assume that the CV is uniform for all measured concentrations. The mean concentrations show <0.1% deviation from the target concentration CP,target = 60 mg/mL. (b) Comparison of CV for drug substance (x axis) against the resulting CV for the drug product (y axis). The parity line is indicated by a dotted line.
Despite the broad spread in the individual simulated values of CP,true, the batch-averaged value remains close to the target concentration across the CV range examined; see Figure 3. The measured final concentration CP,measured shows slightly greater spread than CP,true, because it includes both dilution-induced variability and measurement variability.
From a manufacturing perspective, these results highlight that even in a single-step dilution, analytical variability alone can introduce variability in final formulated concentration. While the process may appear accurate on average, the variability at the individual batch level can be significant and should be accounted for in process design and control strategies.
Implications For Dilution Process Design And Control
Dilution is often treated as a straightforward unit operation. However, the results presented here show that its accuracy and precision are fundamentally linked to analytical performance. In practice, multiple factors can contribute to variability in the final formulated concentration, including assay performance, dilution execution, and the number of dilution steps. In this work, we specifically isolate the impact of analytical variability and demonstrate how uncertainty in protein concentration measurements propagates through the dilution process to influence the final formulated concentration (CP,true). It is important to note that this analysis does not account for other potential sources of variability, such as inefficient mixing or volumetric errors (e.g., pipetting inaccuracies), which may further contribute to deviations in practice.
Key Takeaways
- Variations in the measured formulated concentration, CP,measured, can arise from two sources of variations, both linked to the protein concentration measurement method precision. The first variation arises, as expected, from the error in the final formulated concentration measurement, and the second variation arises from the error in the starting concentration measurement. Figure 2(b) depicts the contribution from the error in the starting concentration measurement to the variations in CP,measured.
- The variations arising from the error in the starting concentration measured can also be explained using Eqn. 2, which shows that the formulated concentration CP,true is inversely related to the measured drug substance concentration as 1/CS,measured. Consequently, deviations in the measured concentration from its true value directly lead to deviations in the formulated concentration, with overestimated CS,measured resulting in underestimation of CP,true and vice versa (see Figure 1(a) for an example). This relationship is nonlinear, such that even deviations of equal magnitude in opposite directions produce asymmetric deviations in the final concentration. As a result, even when the measured concentration follows a Gaussian distribution, the resulting distribution of CP,true deviates from normality. However, under typical manufacturing conditions where the coefficient of variation (CV) is below 3%, this deviation is small and the distribution can be reasonably approximated as Gaussian.
- These results are largely independent of the dilution factor when expressed in relative terms (CV), as error propagation is governed by the nonlinear dependence of CP,true on CS,measured, rather than the magnitude of the dilution ratio. For a given assay CV, the relative variability in the formulated concentration is expected to remain approximately constant across dilution factors. It should be noted that this analysis does not account for additional process-related sources of variability, such as hold-up volumes, transfer inaccuracies, or dilution effects introduced during downstream analytical measurements.
- Process capability (Ppk) provides a useful framework for assessing process reliability. Under typical assumptions — such as specifications defined relative to the target and the process mean remaining near the target — the Ppk for the formulated concentration is inversely related to its coefficient of variation. As shown in Figure 3(b), when variability in the drug substance concentration (CV of CS,measured) increases (e.g., ≥3%), the resulting CV for the measured formulated concentration CP,measured exceeds that of the drug substance. Consequently, the Ppk of the formulated concentration may be lower than expected, indicating that achieving a target Ppk for the formulated product may require tighter control (higher Ppk) of the drug substance concentration measurement. Accordingly, the analytical target profile for the protein concentration method should include sufficiently tight precision requirements to support the desired process capability for the final product.
- Multiple other attributes, such as relative potency, viscosity, etc., depend on the true final formulated concentration, CP,true and, hence, the uncertainty in the starting concentration measurement, CS,measured, also indirectly impacts the precision of these attributes. A detailed discussion on these impacts will be covered in a future article.
- From a process design perspective, these findings highlight several practical considerations. First, analytical variability should be treated as a key contributor to overall process performance, not just a measurement attribute. Second, even modest improvements in assay precision can translate into meaningful reductions in final product variability. More broadly, this work underscores that dilution accuracy is not solely determined by volumetric operations but by the quality of the measurements used to define them. Incorporating uncertainty measurements into process design and control strategies can therefore improve robustness and help ensure consistent product quality.
About The Authors:
 Ramakrishnan Natesan, Ph.D., is a principal data scientist at Amgen who works in the areas of computational physics, soft condensed matter, biophysics, bioengineering, and fluid mechanics. His work focuses on applying multiscale modeling and machine learning for accurate characterization of molecular attributes and early-stage optimization of biologics. Prior to joining Amgen, he conducted postdoctoral work at the University of Pennsylvania. He received his Ph.D. in physics from the Indian Institute of Technology Madras.
 Jenil Patel is a process development principal scientist at Amgen. He serves as the attribute sciences team lead for a monoclonal antibody biosimilar program and focuses on large molecule attribute characterization, analytical method life cycle management, and comparability/similarity studies. Previously, he worked at Pfizer as a protein biomarker scientist. He received his M.Sc. from Northeastern University where he worked a research assistant.
 Neeraj Agrawal, Ph.D., is a senior director in process development at Amgen where he leads the pivotal attribute/analytical sciences team overseeing late-stage product characterization. Previously, he worked as a scientist at Ipsen. He received his Ph.D. in chemical engineering from the University of Pennsylvania and did postdoctoral work at MIT.