
What Managing Personal SARS-CoV-2 Risks Can Teach Us About Managing Pharma Risks
By Mark F. Witcher, Ph.D., biopharma operations subject matter expert
Understanding and managing risks is important for virtually every activity, from personal safety to manufacturing pharmaceuticals. This article describes how the basic principles of managing personal risks of being infected by a respiratory virus can be used to manage risks for developing and manufacturing pharmaceuticals. The goal of this article is to elucidate the basic principles of understanding, managing, and communicating a wide variety of risks from the trivially simple to the very complex.
The structure of the viral risks shown in Figure 1 provides an easy way of identifying, understanding, and controlling the possibility of being infected by the SARS-CoV-2 respiratory virus. The structure is very simple because it deals with how a viral threat from a person on the left might be transmitted through a number of processes to infect a person on the right.
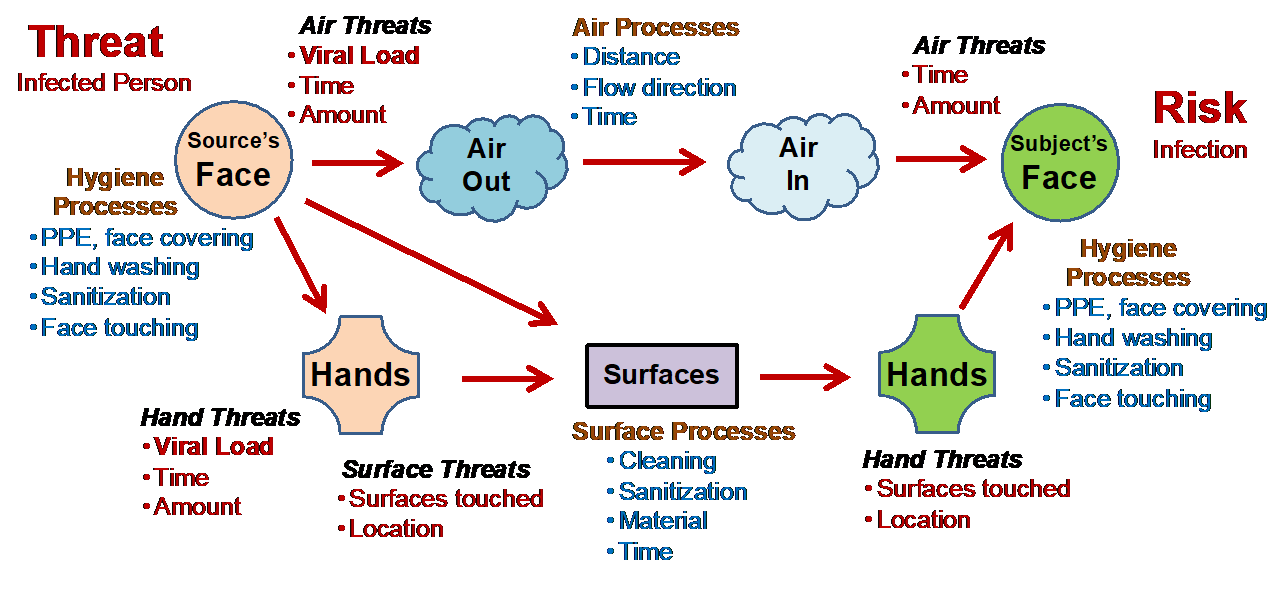
Figure 1: The diagram describes how an infected person on the left might transmit a respiratory virus through a number of “processes” to infect a person or subject shown on the right. By changing the processes, either person can reduce the probability of the source infecting the subject.
Two potential routes or processes of infection are shown. The first is through the air, and the second is via surfaces such as doorknobs and handrails. Figure 1 shows four processes. Both people have personal hygiene processes under their control to possibly prevent the transmission of the virus to and from the air and surfaces. The air process controls the possible movement of the airborne threat from the source to the subject. Surface processes control the possible movement of the viral threat from the source, both by air and hands, to the subject. Improving control is achieved by making one or more of the transmission processes more effective for decreasing the probability of the threat reaching the subject’s face.1
Using the figure in conjunction with observing people’s behavior in public can reveal a great deal about the high variability of how people perceive and manage risks. People will include or ignore the control processes for a wide variety of personal reasons. They may either dismiss the infection as not a significant problem or be highly fearful of their safety. They may consider infection as extremely likely and take extreme measures to prevent infection or they may consider the possibility of infection as highly unlikely. Using the diagram, one can understand and possibly manage their risk of being infected or infecting others by using the following four steps:
- Recognition – Usually, the recognition of risks is initiated by the fear of something bad happening, such as getting COVID-19 disease, based on past experience or knowledge and information. The initial recognition exercise usually simultaneously identifies a mixture of both threats and bad consequences as “risks.” In the case of Figure 1, infected people are identified as the threat and being infected by another person is the negative consequence.
- Investigation – The current situation is analyzed by structuring the threats and consequences to identify how the threats might cause the consequences and by understanding how they are connected by the risk processes. Figure 1 is the product of this exercise. For personal risks, the structure shown is usually intuitive, while in other cases the structure may be documented in some form.
- Understanding – After structuring the threats, processes, and bad consequences, a subjective assessment of how likely the threat might pass through the connecting processes to result in the consequence is estimated. The subject either accepts or rejects the current situation based on their perception of how likely the consequence might be realized. If the risk is acceptable, the subject proceeds with the status quo.
- Prevention – If the subject decides the current situation is an unacceptable risk, they decide what changes in the connecting processes are required to decrease the probability of the consequence to an acceptable level. In the case of Figure 1, prevention ranges from adding a face mask to more sanitization and cleaning to not touching anything or in some cases, a complete avoidance of all the perceived threats.
The rigor of each step can vary widely from one individual to another depending on a variety of preferences, biases, prior experiences, knowledge, risk tolerance, and other subjective influences.2 The differences in people’s risk appetite are vast and they explain why some people will jump out of airplanes for fun while others will not stand on a chair to change a light bulb.
The purpose of this article is to develop the basic concepts behind the method shown in Figure 1 for application to a wide variety of both simple and very complex risks. The approach is to expand the above simple intuitive model to explain basic principles for structuring, managing, and communicating complex risks.
Straightforward Approach To Managing Risks
The method begins with a very simple view of a risk element as the foundation for understanding any risk. A risk has two elements: severity of the consequence and the uncertainty of the consequence occurring. The basic structure of a risk is shown in Figure 2 as an input threat to a risk process that produces an output risk consequence. All risks are caused by something. Despite appearances, they never occur spontaneously. The only difference between a threat and a risk consequence is the process that produces it.
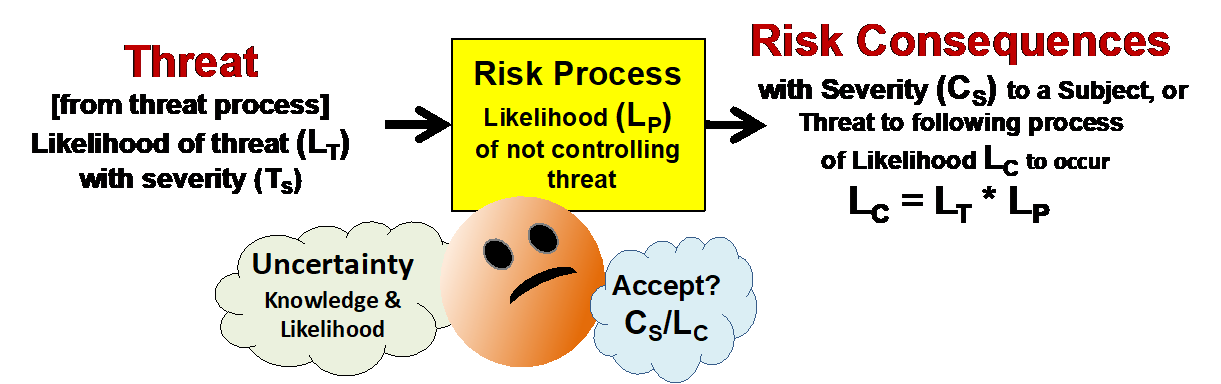
Figure 2: A threat occurs with a severity of TS and an uncertainty of LT to a risk process that has an uncertainty (LP) of passing the threat to result in a risk consequence of severity (CS) and uncertainty of LC. If the uncertainties are treated as simple probabilities in terms of likelihoods, then the likelihood of the risk occurring (LC) is the mathematical product of the likelihood of the threat occurring (LT) and the likelihood of the threat passing through the process (LP) to cause the risk consequence.
A risk process is defined as any sequence of events that takes an input and produces an output. Any change in the process is also considered as an input. Thus, a threat will occur with a probability of LT to a process that passes the threat with a probability of LP to result in a realized risk. The probability that the risk will be realized is the mathematical product of LT and LP. Likelihoods must be expressed as a probability ranging from never (0 percent) to certain (100 percent).
Using the basic elements shown, a wide variety of complex risks can be evaluated by structuring a series of risk processes together to show how various threats can propagate through networks of processes to produce risk consequences. This approach was used to build Figure 1. While personal risks are individually evaluated intuitively for acceptance or prevention, using risk management for biopharmaceutical development and manufacturing risks requires significant communication between individuals and within teams for reaching consensus and alignment and, most importantly, aligning regulatory agencies that must understand and approve the results of quality risk management (QRM) exercises.
The foundation of these communications begins by providing a simple method of numerically rating both severity and uncertainty.
Estimating And Communicating A Risk’s Severity
The severity of a risk will be viewed and communicated in the same way an earthquake is measured by a Richter scale. Although complex, an earthquake can be effectively rated and communicated using a single number. Table 1 shows a simple four-point scale for rating the severity of both a threat and its consequence. In cases where the risk’s severity is unknown, the rating can be adjusted upward to account for the lack of knowledge.

Table 1: A simple logarithmic scale provides an effective method of rapidly communicating a severity ranging from little or no concern (1) to catastrophic (4). The severity rating is the greater of the relative impact or knowledge level.
The use of logarithmic scales for measuring human awareness of physical phenomena is based on the Weber-Fechner law used for efficiently rating human perception of earthquakes, hurricanes, light intensity, etc. Risk consequences rated as 1 might typically be quickly accepted without further analysis, while those rated 4 would be subjected to considerable study to assure they are appropriately controlled. The threat’s severity or importance is rated to facilitate the analysis. A threat, no matter how severe, does not impact the subject if it does not propagate through the risk process shown in Figure 2. Once a risk is defined, the severity of the risk consequence does not change. Some risks may be evaluated at multiple severity levels (e.g., with and without detection). The severity of some risks can be easily rated by financial loss while others may have a significant subjective personal value component, as shown by the high variability of people’s concern for being infected or infecting other people.
Rating and communicating the second risk element, uncertainty, is the most difficult and is the primary cause of problems related to the current methods of managing risks.
Estimating And Communicating Uncertainty
Uncertainty has two parts. The first is a probability of a risk consequence occurring. The second is the level of knowledge for making that estimate. The probability of rolling snake eyes in a fair dice game is precise and can be described mathematically. However, the probability of a future event, such as an earthquake or an operator making a mistake in setting up a process, can be highly variable and subjective. Estimating the probability of future events can range from an educated guess based on data to a wild guess based completely on intuition. Either way, predicting the future is always a guess.

Table 2: Simple logarithmic uncertainty rating. The likelihood rating would be the greater of the probability or knowledge level rating. The mitigation strategy might be to gather additional knowledge about LT and LP to better estimate LC. Ratings of 5 (certain) and 0 (never) are special cases. If either LT or LP is rated a 5, then LC becomes the value of the remaining likelihood rating.
Defining uncertainty in terms of subjective probabilities is very challenging. More often than not, the probability or likelihood of any future event or result is purely a subjective estimate based on experience and knowledge. The quality of the estimate is determined by the expertise used to make the estimate. One method that can be used is prospective causal risk modeling (PCRM).2 PCRM evaluates the causal mechanisms within the process or sequence of activities based on data, information, or intuition to understand and estimate the probability or likelihood of the threat resulting in a realized risk. Estimating probabilities is guessing the future and is vulnerable to a wide variety of biases and prejudices that can be controlled to some extent if they are understood and considered when estimating likelihoods.2
Quality Risk Management
Using the rating tables, a risk can be rated by the designation CS/LC. The two ratings are so fundamentally different that combining them in any way can produce a nonsensical number that conceals one or both elements. For example, a 4/1 risk is a very different risk consequence than a 1/4, and thus CS and LC cannot be combined.
The likelihood of the risk may be different for each threat. A convenient method of evaluating the threats is to look at each one as a combination of the threat’s severity (TS) and likelihood (LT), since each threat is a risk consequence from a prior process, along with the likelihood that the threat will pass through the risk process (LP). For each threat, TS/LT and LP provide a good communication tool for understanding how likely the threat will produce an important risk consequence. Thus, each risk can be compactly evaluated and communicated using three terms: CS/LC, TS/LT, and LP.
The primary regulatory reference for managing pharmaceutical risks is ICH Q9 – Quality Risk Management (QRM).3 The guidance emphasizes risk communications and describes a number of QRM approaches. All of the approaches listed in the guidance either ignore or do not treat uncertainty properly, making them difficult if not impossible to use effectively. ICH Q9 describes a four-step method similar to the approach used to manage the viral threat in Figure 1. Using a system risk structure (SRS) with PCRM, the four-step approach described earlier provides the basis for the following ICH Q9 - QRM approach:2, 4
- Identification (recognition) – Identify the threats and consequences of concern. Rate the severity of the threats as TS and consequences as CS. Accept consequences with CS = 1, if possible.
- Analysis (investigation) – Structure processes between the threats and consequences to build an SRS.4 What threats cause which consequences? Which consequences are caused by what threats? Rate the consequences as CS and identify obvious LC = 1 for possible acceptance.
- Evaluation (understanding) – Use intuition or PCRM to estimate CS, TS, LT, and LP for each threat/consequence pair to estimate LC.2 Document CS/LC, TS/LT, and LP along with their rationale and supporting information using a risk register (RR).
- Mitigation (prevention) – For unacceptable risks, modify the risk process to reduce (LP) and/or change the threat process if possible or add a new process to reduce the likelihood of the threat (LT) to the risk process. Rerate CS/LC, TS/LT, and LP for acceptance and document the control rationale in the RR.
Using the four steps is a straightforward approach to initially brainstorming the threats and risk consequences, then connecting them to understand the risk’s severity and an initial guess at the risk’s likelihood of occurrence. Unacceptable risks are then further evaluated to better estimate and describe each risk’s likelihood of occurrence. For those original risks that cannot be accepted, the threat and risk processes are examined and modified to change the likelihood that the risk consequence will occur to an acceptable level. This approach can be effectively used to evaluate the viral safety risks shown in Figure 1 by intuitively evaluating the various TS, LT, and LC values for the specific situation one might encounter at grocery stores, restaurants, and personal meetings. Of course, a critical part of the analysis is to assess the knowledge level of the threat’s uncertainty. A major part of both the severity and likelihood ratings or situational assessment might be the poor level of knowledge of what threat sources are in the analysis, including asymptomatic or semi-symptomatic people who may or may not know they are infected and what personal hygiene processes they were using.
To briefly demonstrate the QRM approach, the following simple pharmaceutical example will be used to describe the basic concepts.
Managing Pharmaceutical Risks – An Example
A simple filter process unit operation is shown in Figure 3. Also included in the exercise is the standard operating procedure (SOP) “process” and the operator “process,” which takes the input from the SOP and executes the operating sequence to set up and operate the filtration step. The expert team constructed Figure 3 after brainstorming the risk consequences and threats in the identification step, then structuring them into an SRS with the three processes in the analysis step.

Figure 3: Simplified filter system risk structure (SRS) and risk register (RR) to manage the risks to minimize the likelihood of a filtration step failure. The SRS includes the SOP, operator, and filter processes. The filtration unit operation (UO) is subject to two kinds of threats — input threats from the previous UO and execution threats from the operator and SOP.
In this greatly simplified example, most of the risks are accepted. The team identified the threats and consequences shown in red as significant enough to build an RR, giving the team’s severity and likelihood ratings as shown. The RR might also include a verbal summary of the rationale for the ratings. The final step would be to make the necessary changes in the SOP, operating, and filter processes, including the filter equipment, necessary to reduce the likelihoods to acceptable levels. An alternative analysis would be to combine the operator process and the SOP into a single process and view improper execution as a risk consequence. SRSs and RRs can take many different forms and scopes depending on the nature and importance of the QRM exercise.
Summary
SRSs can take a wide variety of forms to achieve many different objectives. In some cases, a large, complex SRS can be subdivided into smaller exercises to identify and control individual risk consequences that might threaten other processes. The purpose of the SRS is to identify the processes involved in the risks of concern and to track the flow of threats through the processes to produce significant risk consequences. If the likelihood or uncertainty of the threats producing the consequence are unacceptable, then the processes in the SRS can be modified or additional information collected.
The approach described can be used intuitively to solve simple risk problems such as the risk of being infected by opening a door or to develop a comprehensive QRM exercise for controlling biopharmaceutical processes or even building QMSs.5 Once the SRS and RR have been developed, they can be used for continuous improvement by understanding a realized risk by working the SRS backward as a root cause analysis (RCA) to improve the processes and their control strategies to prevent future failure consequences.
References:
- Booth, C.M., Applying Aseptic Practices To Protech Yourself From COVID-19, Outsourced Pharma, https://www.outsourcedpharma.com/doc/applying-aseptic-practices-to-protect-yourself-from-covid-0001
- Witcher MF. Estimating the uncertainty of structured pharmaceutical development and manufacturing process execution risks using a prospective causal risk model (PCRM). BioProcess J, 2019; 18. https://doi.org/10.12665/J18OA.Witcher
- FDA (CDER/CBER) – Guidance for industry: Q9 quality risk management. June 2006. ICH. https://www.fda.gov/downloads/Drugs/Guidances/ucm073511.pdf
- Witcher MF. Analyzing and managing biopharmaceutical risks by building a system risk structure (SRS) for modeling the flow of threats through a network of manufacturing processes. BioProcess J, 2017; 16. https://doi.org/10.12665/J16OA.Witcher
- Witcher, M. F., A Straightforward, Risk-Based Approach to Better Quality Management System Design, Pharmaceuticalonline.com, March 18, 2020 https://www.pharmaceuticalonline.com/doc/a-straightforward-risk-based-approach-to-better-quality-management-system-design-0001
About the Author:
 Mark F. Witcher, Ph.D., has over 35 years of experience in biopharmaceuticals. He currently consults with a few select companies. Previously, he worked for several engineering companies on feasibility and conceptual design studies for advanced biopharmaceutical manufacturing facilities. Witcher was an independent consultant in the biopharmaceutical industry for 15 years on operational issues related to: product and process development, strategic business development, clinical and commercial manufacturing, tech transfer, and facility design. He also taught courses on process validation for ISPE. He was previously the SVP of manufacturing operations for Covance Biotechnology Services, where he was responsible for the design, construction, start-up, and operation of their $50-million contract manufacturing facility. Prior to joining Covance, Witcher was VP of manufacturing at Amgen. You can reach him at witchermf@aol.com or on LinkedIn.