
System Risk Structures: A New Framework For Avoiding Disaster By Managing Risks
By Mark F. Witcher, Ph.D., biopharma operations subject matter expert
Risks are ubiquitous, occurring in every aspect of our personal and professional lives. This article describes how pharmaceutical development and manufacturing risks can be easily understood and effectively managed using straightforward concepts. Like all risks, pharmaceutical risks take many forms and appear everywhere. An effective quality risk management (QRM) approach should be applicable to everything from situational awareness to avoid taking foolish chances to evaluating complex systems for managing important pharmaceutical product quality risks.
As stated in ICH Q9,1 risk is a deceptively complex combination of severity of impact and uncertainty, best summarized in a simple definition of “something bad could happen.”2 Identifying when something bad has an unacceptably high possibility of happening and then proactively managing the situation to prevent it from occurring is the challenge. Some people have an innate ability to size up situations to protect themselves, while others do not appear to have such skills, occasionally with dire consequences. One trait that separates successful managers from those who are not is the ability to stay out of trouble by identifying, understanding, and dealing with situations that have both obvious and hidden risks. This article provides a framework for anyone, especially scientists, engineers, and managers, to understand and deal with risks.
The basis for the approach presented here is that managing risks boils down to a simple decision: accept the situation as it is or do something about it. As described in a recent book, Radical Uncertainty, the key to making good decisions starts with answering the simple question, “What is going on here?”3 But, how do you understand what is happening with the current situation? And, if you cannot accept the status quo, how do you decide what to do differently?
A Basic Element Of Risk
Despite appearances, a realized risk consequence is always caused by some kind of realized threat. Figure 1 shows how a threat might enter a risk process and produce a risk consequence. Most risk processes are designed to control a variety of inputs, including threats, to assure successful outputs. For example, a car can be viewed as a risk process designed to prevent serious injury to the driver from a variety of threats, like hitting something or being hit by another vehicle. Similarly, an operator and a standard operating procedure (SOP) can be viewed as a process to complete a specific task despite a variety of possible threats.
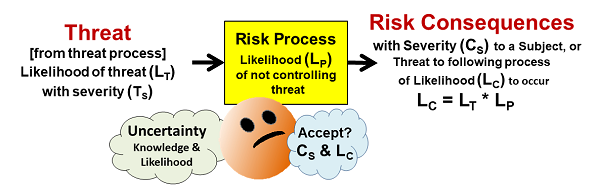
Figure 1: A simple risk element that shows a threat of likelihood LT entering a process that has a likelihood LP of not controlling the threat and thus producing a consequence of severity CS with a likelihood LC. Treating the likelihoods as probabilities, the likelihood of the consequence LC is the mathematical product of the threat’s likelihood LT and the risk process’s likelihood LP of not controlling the threat.
As shown in Figure 1, a risk has the following elements:
- Risk Consequence – the “bad thing” that might happen to a subject. The severity (CS) can range from catastrophic to very little impact, and the likelihood (LC) of the consequence can similarly be rated from near certain to highly unlikely.
- Subject – the person or entity hurt by the consequence’s realization. Identifying a subject is important for understanding the risk’s severity rating. Clearly identifying a risk’s subject allows the QRM exercise to focus on a specific risk. In the case of pharmaceuticals, it is especially important to focus on a consequence to a specific subject, such as a contamination at a particular point in the manufacturing process from a threat, rather than a poorly defined very distant subject like the quality of the final product. The risks to the final product can only be understood and managed using a clear definition of all the processes between the threats and the final product.
- Risk Process – A risk process can be anything that takes inputs and produces an output. A process can be a person, SOP, practice, piece of equipment, unit operation (such as a bioreactor), or any sequence of events that takes an input and produces an output. Processes can be combined together or separated into subprocesses depending on the need to manage specific threats or risk consequences. Understanding how the process works is critical to estimating the likelihood (LP) of the process not controlling the threat.
- Threat – A threat can be any bad or abnormal input the process may or may not be designed to handle or manage. A change in the risk process, such as a failure or broken component, is also viewed as an input threat. A threat is a consequence of a prior threat process. Depending on the nature of the threat process, the likelihood of the threat occurring (LT) can be estimated.
The approach shown in Figure 1 has the following five benefits not found in current ICH Q9 QRM methods:
- It provides a mechanism for understanding a risk in terms of identifying threats and consequences. In the early stages of a QRM exercise, the threats and risk consequences are usually commingled, with no method of sorting out what you are really afraid might happen. When the threats and consequences are connected by processes, along with identifying the subject that might be hurt, they become structured in system risk structures (SRS) for analysis.
- Once the risks have been structured by an SRS, specific uncertainties and likelihoods can be identified and estimated as probabilities. These probabilities can then be combined and manipulated using sound mathematical principles.
- It provides a clear mechanism for controlling risks. By modifying the threat and risk processes to reduce the likelihood of the threat occurring and then propagating through the risk process LP, the likelihood of the risk consequence LC can be reduced to an acceptable level.
- An SRS provides the foundation for understanding very complex situations where a synergy of threats might result in risk consequences. In some cases, the input threats can be highly interactive, greatly affecting the likelihood of a realized risk consequence.
- The SRS can be worked backward as a root cause analysis (RCA). If a QRM is performed, an SRS provides an excellent start at understanding what threat or threat combination might have produced either the realized risk consequence (action) or came close to producing a consequence (alert). The use of an RCA for continuous improvement exercises, by understanding both near misses (alerts) and failures (actions), is the foundation of achieving high-quality operations.
Probably the most important part of accepting and managing risks is defining and communicating severity and uncertainty to establish both personal alignment and team consensus on a risk’s severity and uncertainty. The following two tables define severity and uncertainty using logarithmic scales based on the Weber-Fechner law for rating the human perception of complex phenomena, like earthquakes, light intensity, and tornados, that span many orders of magnitude of energy or levels of concern. We begin with severity, the more straightforward of the two parts of a risk.
Rating And Communicating Severity
Severity of impact can be frequently evaluated as a financial loss, number injured, etc. Severity, especially when based on personal preferences and perceptions, can also vary a great deal based on a wide variety of biases and inclinations. Once a risk consequence is defined, its rating does not change. Some risk consequences may be defined for multiple scenarios, such as contamination with and without detection. Table 1 rates severity in the simplest terms from 1 (minimal impact) to 4 (catastrophic). Typically, a risk rated as a CS = 1 would be quickly accepted. As the severity rating increases, the level of analysis to understand the risk’s likelihood increases.
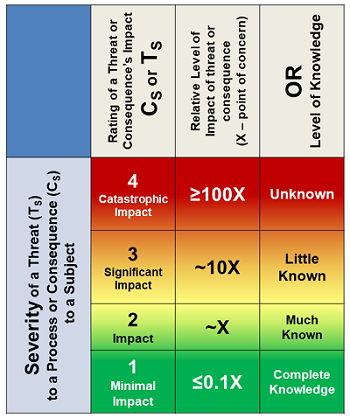
Table 1: Much like earthquakes are rated using a Richter scale, a risk consequence can be efficiently rated by a logarithmic scale from 1 to 4 based on the greater rating of the knowledge level of the risk or the impact’s severity evaluated as 1 (minimal) to 4 (catastrophic). A rating of 2 is defined as a baseline impact for concern from the consequence’s realization.
The severity rating can also be based on the level of knowledge about the consequence’s impact on the subject. The rating selected should be the greater of the uncertainty or impact. The severity rating is the first determinant for either accepting the risk or further analyzing it to better understand its likelihood of occurrence.
A risk’s likelihood of occurrence is by far the most difficult attribute to estimate. The challenge of estimating the likelihood of any future event requires using individual and collective experience and intuition, based on information and knowledge of the past performance of other, hopefully similar, processes.4)
Rating And Communicating Likelihood Of Occurrence
Uncertainty has two elements. The first is the probability of the risk consequence occurring, while the second is the amount of knowledge and information on which the LC estimate is based. Like severity, a simple four-point 1 to 4 logarithmic scale is used in Table 2, with two special cases of 0 – Never – and 5 – Certain – included to complete the full range of probabilities from 0 to 100 percent.
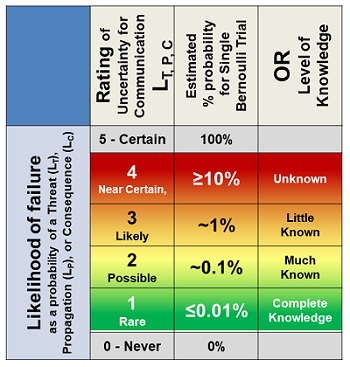
Table 2: Likelihood table for rating the likelihood of: a threat occurring LT; a realized threat propagating through a process LP; and a consequence occurring LC. Either a threat or consequence with a rating of 0 or 5 would likely not be included in a QRM. The impact of a risk process controlling a threat rated as either 0 or 5 is obvious. The likelihood of a risk consequence is the mathematical product of the likelihood of the threat and consequence’s occurrence.
The probabilities in the second column reflect the percent likelihood of a single event. If the event occurs frequently, the rating may need to be adjusted using a probability distribution.4
So how do you guess likelihoods? The basic concept is to understand how the risk processes work to identify how a bad input might cause the process to produce a bad output. All processes have causal mechanisms by which they function and perform. By studying the process mechanisms of operation using prospective causal risk modeling (PCRM), a process can be analyzed to estimate how likely the process is to control threats.4 Obviously, the more experience an expert or team of experts has with a particular or similar process, the better the estimate of the process’s robustness for controlling any given threat.
Accepting Risks
The ultimate outcome of every QRM exercise is the acceptance of all risks. Hopefully, all the important risks have been identified because unidentified risks are accepted by default. Typically, risks with CS = 1 or LC = 1 are accepted fairly quickly. As the level of severity increases, the QRM becomes more comprehensive. When the combination of CS and LC is unacceptable, then the threat or risk processes can be modified, or additional processes added to reduce LC to an acceptable level. In some cases, the cost of process modifications may play a role in accepting some risks.
One QRM outcome is evoking the precautionary principle (PP), roughly defined as “better safe than sorry.” Some risks have such unique dire consequences, such as some outcomes from global warming, that using the PP may be appropriate. Risks with LC = 1 and CS = 4+ may warrant evoking the PP and thus be subject to additional analysis to reduce LC to as close to 0 as reasonably possible.
Having developed a method of understanding and mitigating risks, a method of analyzing systems of processes is required. A single risk process can be broken down into subprocesses, making the risk process a system. For example, a car can be viewed as an assembly of processes that include the driver, seatbelts, tires, engine, and other components to better identify threats and risk consequences. Certainly, the driver is a critical subprocess that has a significant impact on the likelihood of bad things happening to the car.
System Risk Structures (SRS)
If the basic element in Figure 1 is viewed as a puzzle piece, then a system can be viewed as a puzzle that must be assembled using pieces made by combining basic elements sized and shaped to fit together to understand how various input threats might propagate through processes to result in risk consequences. Figure 2 provides a basic structure by which the elements can be assembled into a sequence or network. The structure may take the form of a branched network because a particular risk consequence might result from multiple threats and a threat might cause one or more risk consequences. For large systems, the SRS might have to be broken into manageable sized subsystems for analysis and management.
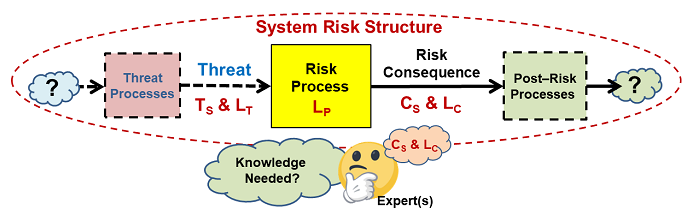
Figure 2: An SRS is formed by connecting threats and consequence with processes. The only difference between a risk consequence and a threat is the process that produces it. A threat might cause more than one consequence and a consequence may be caused by more than one threat.
The approach described can cover a wide variety of problems. Two brief examples are provided to explain the underlying concepts. The first is a risk analysis that might be developed intuitively to manage the risks of letting one of your children take their first solo trip to the store after acquiring their driver’s license.
Inexperienced Drivers
Situations that may look simple on the surface can have very complex risk interactions. The SRS in Figure 3 might be envisioned to understand the risks of driving a car, especially by a teenager. The SRS provides an understanding of how threats might synergistically combine to produce realized bad consequences. For example, external condition threats, such as bad weather, can combine with driver threats (e.g., lack of experience) to significantly alter the likelihood of risk consequences.
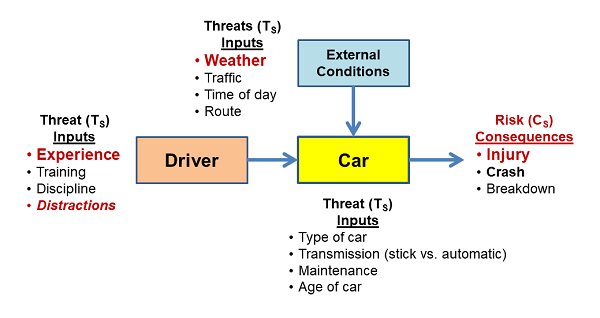
Figure 3: An SRS associated with driving a car. Such an SRS reflects an intuitive understanding of the various threats that might cause bad things to happen. In some cases, the input threats may have significant interactions that can be understood by analyzing the impact of one threat combining with other input threats using thought experiments or formal SRS scenarios.
Identifying and analyzing all the important threats is key to managing the processes, especially, in this case, the driver, to control significant risks. The figure above was the result of an inexperienced driver being killed on their first solo trip to the store in a nearby county while texting a friend. The apparently unidentified distraction threat can be properly understood by any experienced parent who takes the time to structure the threats in the context of the possible consequences. However, never letting your teenager drive – my first reaction, — would likely be an inappropriate use of the PP instead of appropriately controlling the threats – e.g., talking about texting while driving.
The SRS in Figure 3 has some obvious transference to the pharmaceutical industry because many operations require people to perform important tasks.
New Operators Using A New Procedure
The next example shows a very brief QRM of the interactions of an operator and an SOP. The SRS is shown in Figure 4, with a summary risk register (RR) shown in Table 3.
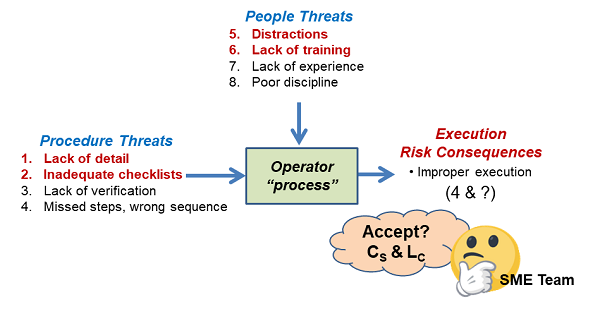
Figure 4: The complex input threat interactions of an operator performing a task using a new procedure. The analysis starts by identifying the threats and consequences, followed by building the SRS around the process. After the SRS is assembled, a risk register such as that shown in Table 3 can be used to align the team with respect to estimating the various uncertainties and then accepting or mitigating the input threats to assure the task has an acceptable chance of being successfully completed.
After the SRS was assembled, the threats were evaluated and the results placed into the RR shown in Table 3. Likelihood values reflect the initial estimates based on a review of the drafted procedure and the current pool of new operators.
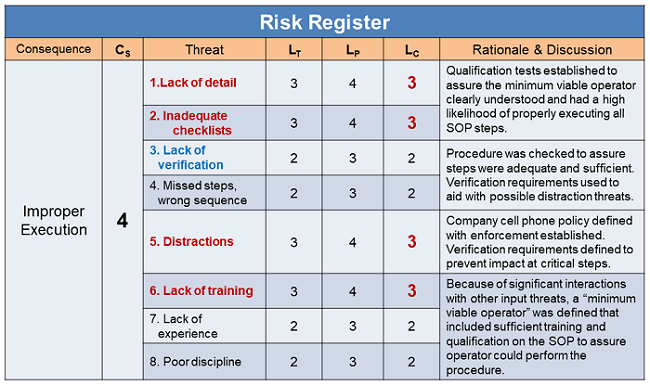
Table 3: Abstracted summary risk register for execution risks structured in Figure 4. LC values reflect the pre-remediation values. All post remediation LC values were estimated to be 1 after the SOP process was modified and reviewed in the context of the new operator processes. In some cases, the new operator training was enhanced to increase their understanding of the SOP to reduce the likelihood of mistakes.
Should execution of the procedure result in either a failure or a near miss, the SRS and RR provide excellent starting points for a root cause analysis (RCA) to improve the operator-SOP process.
The use of an SRS with significantly more complex systems, such as single-use bioreactors (SUBs) and cleanroom airflows, has been covered in earlier publications.6 An SRS can take many different forms and contain a wide variety of details to achieve the goals of the QRM exercise. In some cases, an SRS can be subdivided to control important intermediate threats to reduce the likelihood that the threats will be propagated and result in major risk consequences of concern.
Summary
As described in ICH Q9, the purpose of a QRM is to identify and accept all relevant risks. As shown in the following figure, the risks are identified for a subject by brainstorming threats and consequences, then structuring those threats and consequences with processes.
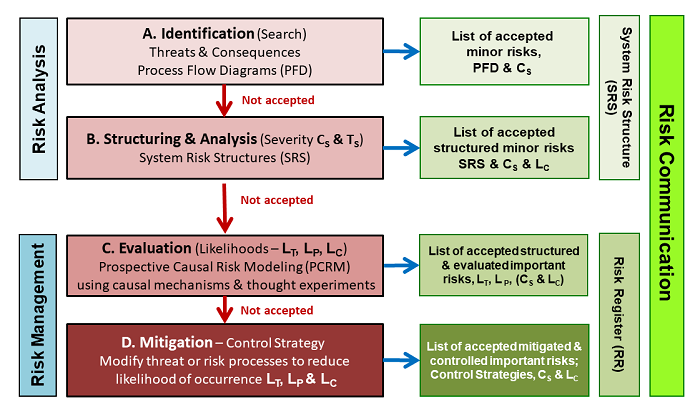
Figure 5: An extension of the approach shown in the iconic figure in ICH Q9 lists the four steps for executing a QRM in terms of the SRS approach using the basic risk elements shown in Figures 1 and 2. The QRM initially builds an SRS to describe how threats might flow through processes to produce consequences. A risk register is then constructed to show the consensus ratings of severity and likelihood, along with the rationales used to develop and justify the ratings and control strategies.
After an initial estimate of likelihoods and severity, risks of concern are further evaluated, and for risks that are unacceptably controlled, steps are taken to modify the risk processes so that all risks can be accepted. In many cases, it may be desirable to break the system into subsystems or processes to simplify the QRM into manageable exercises.
References:
- FDA (CDER/CBER) – Guidance for industry: Q9 quality risk management. June 2006. ICH.
- Hubbard, D.W., The failure of risk management: Why it is broken and how to fix it, Wiley, 2009.
- Kay, J. and M. King, Radical Uncertainty: Decision-Making Beyond the Numbers, W. W. Norton &Co. Kindle Version, 2020.
- Witcher MF. Estimating the uncertainty of structured pharmaceutical development and manufacturing process execution risks using a prospective causal risk model (PCRM). BioProcess J, 2019; 18. https://doi.org/10.12665/J18OA.Witcher
- Witcher MF. Analyzing and managing biopharmaceutical risks by building a system risk structure (SRS) for modeling the flow of threats through a network of manufacturing processes. BioProcess J, 2017; 16. https://doi.org/10.12665/J16OA.Witcher
About the Author:
 Mark F. Witcher, Ph.D., has over 35 years of experience in biopharmaceuticals. He currently consults with a few select companies. Previously, he worked for several engineering companies on feasibility and conceptual design studies for advanced biopharmaceutical manufacturing facilities. Witcher was an independent consultant in the biopharmaceutical industry for 15 years on operational issues related to: product and process development, strategic business development, clinical and commercial manufacturing, tech transfer, and facility design. He also taught courses on process validation for ISPE. He was previously the SVP of manufacturing operations for Covance Biotechnology Services, where he was responsible for the design, construction, start-up, and operation of their $50-million contract manufacturing facility. Prior to joining Covance, Witcher was VP of manufacturing at Amgen. You can reach him at witchermf@aol.com or on LinkedIn.