
Stage 3a: A Key Indicator For Process Validation Maturity
By Ajay Pazhayattil and Marzena Ingram

Process validation life cycle principles1 are increasingly adopted in the pharmaceutical industry to ensure robust and reproducible processes. Repeat U.S. FDA observations highlight the need to determine, better understand, and address variability within and between batches.2 The criticality of process parameters and material attributes in influencing critical quality attributes (CQAs) is studied as part of QbD process development. However, despite the 15 years since the introduction of ICH Q8 (R2), there is still a need for consistency in defining process parameters and attributes. This article explores the significance of correctly identifying process input variables, clarifying their role in achieving process control, advancing practices from outcome-based to input-based controls, and achieving organizational process validation maturity (PVM).
A key focus of the life cycle approach to process validation is on understanding and controlling parameter and attribute variability at all stages: Stage 1 (process design), Stage 2 (process qualification), and Stage 3 (continued process verification), both intra-batch (within a single batch) and inter-batch (between different batches). The relationship of process parameters (PPs) and material attributes (MAs) to CQAs and the degree of their influence must be thoroughly characterized. Misclassifications, such as treating observed outcomes as parameters, can result in poorly designed control strategies. This may stem from historical assumptions about parameters and attributes.
Process parameters (PPs) are defined as process input variables. For example, set pump pressure, nozzle design, and spray angle are parameters in a spray process, while the spray rate is a calculated outcome/attribute, not an input. Another example is the observed jacket temperature, where the input PP controls are the related chiller and jacket settings (Figure 1). A critical process parameter (CPP) is a process parameter whose variability impacts a CQA.3 These must be tightly controlled to maintain product quality. Process parameters and material attributes can influence the in-process and final attributes independently or in combination.
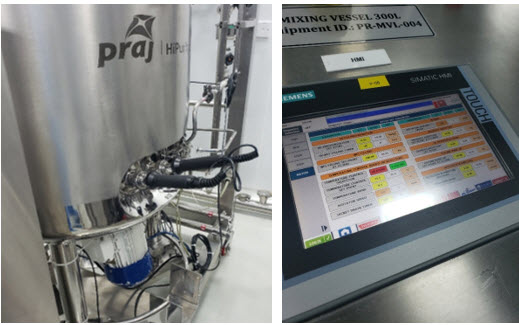
Figure 1: Mixing vessel and chiller parameters. Left image: mixing vessel.
Right image: setup process parameters.
Image courtesy: ITAAN PHARMA.
Pharmaceutical manufacturing evolved on attribute-based controls, where outcomes such as in-process pH, uniformity, in-process assay, dissolution profiles, or particulate count were the primary focus. With the life cycle approach and manufacturing maturity, the emphasis is now on managing and controlling the up-front input process parameters that direct the outcomes. To develop a parameter-based control strategy, organizations must initially identify all parameters (input variables), fix them where possible, generate supporting evidence during routine qualification, and set and control variability limits. Stage 1 design of experiments (DoE) process development studies play a pivotal role in offering critical insights that guide the development of control strategies. It is the responsibility of R&D QA to rigorously challenge all conclusions drawn during this stage, ensuring the accurate identification of parameters, proper classification of CPPs, and an objective assessment of their impact on CQAs (Figure 2). This includes reviewing the extent of data generated to establish the relationships, the statistically sound analysis supporting the proposed control strategy, and the availability of scientific justifications that rule out/in a process parameter as “critical.”
Inadequate process characterization or failure to appropriately determine these relationships can result in significant downstream challenges, such as achieving process robustness, scalability, regulatory compliance, and post-approval change flexibility. The lack of understanding of the impact of process parameters on the attributes necessitates a thorough reassessment with extensive process data collection enabled through a Stage 3a protocol with heightened parameter monitoring, sampling, testing and statistically sound analysis.
Continuing to meet the initially established CQAs does not mean the process is well understood and characterized; additional control measures may still be necessary, requiring Stage 3a data collection and assessment for almost all legacy/minimally characterized processes.
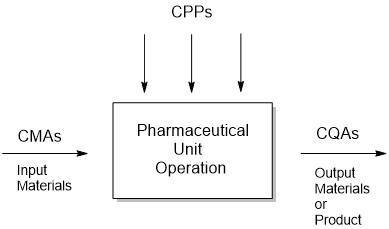
Figure 2: CPP, CMA impacting CQA variability.
The Importance Of Stage 3a In Process Validation
Following commercialization and the production of a significant number of commercial batches, organizations still rarely reassess the adequacy of the design space established during process development Stage 1. Stage 3a serves to reconfirm the assumptions made during design space development and can recommend an appropriate/optimal Stage 3b routine monitoring plan.4 It consolidates data from all three PV life cycle stages to establish variability estimates and comprehensively assess process robustness. The relevance of Stage 3a is particularly pronounced for new modalities, such as biologics, and emerging processes, like transdermal drug delivery systems (TDDS). Common misconceptions about limited assessments include minimal batch numbers or testing constraints. However, properly implemented with the help of subject matter experts, Stage 3a can ensure robust process understanding, particularly for new product launches and novel product and process types.
It has been seen that CQA variability estimates are often expressed through metrics such as Cpk, Ppk, or tightened specifications. However, these approaches fail to effectively capture inter-intra batch CQA variability (e.g., uniformity). (See Table 1 for an example of inter-intra batch variability assessment criteria.)
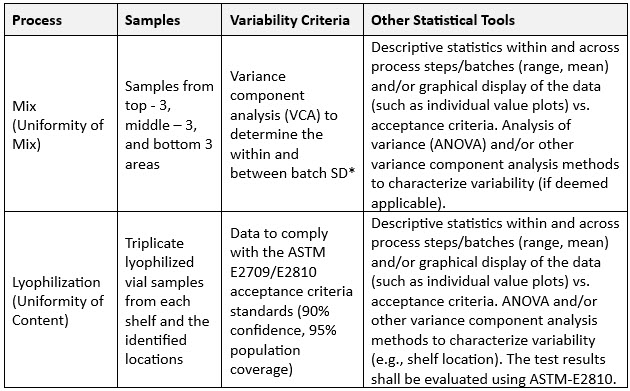
Table 1: Inter-intra batch variability assessment criteria example.
*VCA is used to understand the contributing sources of variation.
Uniformity results, such as that of a mix, provide significant insights into the process, enabling the evaluation of future manufacturing and scale changes, particularly relevant for powders and suspensions. In sampling, it is critical to account for the geometry of the vessel. For example, the grouped area variance estimate (GAVE)5 involves collecting samples from grouped areas such as the “top,” “middle,” and “bottom” of the vessel. This sampling pattern allows for statistical analysis of both within area (variability within each area) and between area.
VCA is a valuable tool for analyzing mix uniformity and gaining insights into variability. Sampling plans typically involve single tests per location but multiple tests per area to enable VCA. Variance components are calculated using statistical methods like restricted maximum likelihood (REML), Bayesian analysis, or analysis of variance (ANOVA), depending on the balance of the sampling plan and the presence of negative variance components. The analysis distinguishes between within-area variability (e.g., sampling bias or analytical error) and between-area variability (e.g., poor mixing or process-related uniformity issues). High between-area variability often points to mixing issues, while high within-area variability indicates potential biases or errors.6 As an example, in the case of one batch (see Figure 3), 83% of the total variance was attributed to within-area variability, signifying minimal process-related variability.
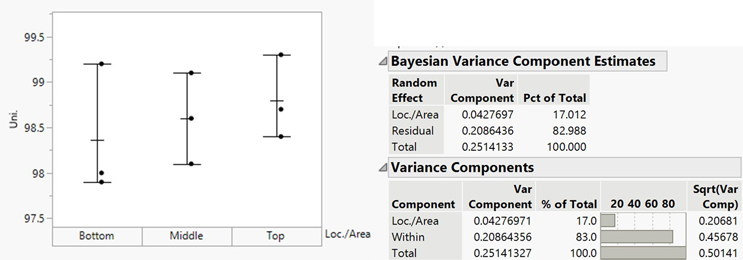
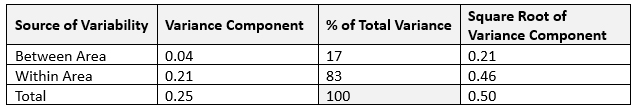
Figure 3: Variance component estimates
VCA also can estimate variance between batches, facilitating a deeper understanding of process robustness. Along with the aforementioned mix uniformity, dosage unit variability can be estimated using ASTM E2810 statistical approaches7 for dosage forms such as lyophilized vials, transdermal delivery systems, tablets, or capsules, and dosage unit variability can be estimated using ASTM E2810 statistical approaches (see Table 2 for an example).
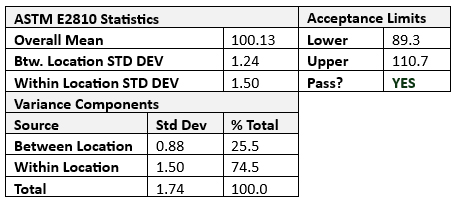
Table 2: ASTM E2810 criteria applied.
The total variability (S2Overall) in Stage 3a can be expressed as the sum of process variability, analytical variability, and other contributing factors (S2Overall = S2Process + S2Analytical + S2Other). To determine meaningful estimates, all the Stage 3a batches should be processed on the same qualified equipment by trained operators adhering to standard operating procedures (SOPs), with raw materials consistently sourced from the same manufacturers, testing conducted using standardized test methods and facility/environmental controls, and monitoring in place to ensure consistent processing conditions. Given these controls, S2Other can typically be assumed to be negligible, leading to a simplified model, i.e., S2Overall = S2Process + S2Analytical.
Translating Your Stage 3a Findings Into Actionable Improvements
Figure 3 and Table 2 show that variance component analysis can easily deduce the inherent process variability (S2Process) and analytical variability contributions. Continually monitoring inherent process variability (S2Process) provides insights into process consistency. An increase in S2Process highlights an increase in batch-to-batch variability, requiring process review for potential optimization. A decrease suggests improved process consistency, reflecting successful control measures. A PaCS index8 can be calculated against the median inherent process variability for benchmark products using similar processes (S2Benchmark). The ratio provides a relative measure of process performance (PaCS = S2Benchmark/S2Process). A PaCS of more than one indicates higher variability for the current product than the benchmark, and a PaCS of less than one indicates minimal variability in relation to similar products/processes.
The strategic application of Stage 3a insights transforms decision-making and risk management. Leveraging this data allows organizations to evaluate the impact of process changes, support data-driven justifications, and enhance change management practices. A comprehensive Stage 3a review reinforces process reliability and establishes a strong foundation for operational excellence. Manufacturers also can effectively assess the impact of process parameters (where variability is allowed) on CQA by integrating rigorous statistical methodologies with established pharmaceutical manufacturing science. Variability assessments allow for the proactive refining of the initially established control strategies before a failure. One of the hallmarks of process validation maturity (PVM) lies in translating Stage 3a findings into actionable improvements, ensuring product safety, quality, and regulatory compliance.
References
- FDA. Guidance for Industry, Process Validation: General Principles and Practices, U.S. Food and Drug Administration, Jan 2011. http://www.fda.gov/downloads/Drugs/Guidances/UCM070336.pdf (2011)
- FDA. Published 483s data, U.S. Food and Drug Administration, Nov 2024. https://datadashboard.fda.gov/ora/cd/# (2024)
- ICH. Q8 (R2)- Pharmaceutical Development, International Conference on Harmonization of Technical Requirements for Registration of Pharmaceuticals for Human Use, Aug 2009. https://database.ich.org/sites/default/files/Q8_R2_Guideline.pdf (2009)
- Sayeed-Desta, N.; Pazhayattil, A.B.; Collins, J.; Chen, S.; Ingram, M.; Spes, J. (2017). Assessment Methodology for Process Validation Lifecycle Stage 3a, AAPS PharmSciTech, 18(5):1881-1886.
- Sayeed-Desta, N.; Pazhayattil, A.B.; Collins, J.; Doshi, C. (2018). A Science and Risk-Based Pragmatic Methodology for Blend and Content Uniformity Assessment, AAPS PharmSciTech, 19(3):1483-1492.
- Nunnally B. (2009). Variance component analysis to determine sources of variation for vaccine drug product assays. J Validation Technol.,15(3):78–88.
- ISPE. Good Practice Guide: Process Validation, Mar 2019. https://ispe.org/publications/guidance-documents/good-practice-guide-process-validation
- Collins, J; Sayeed-Desta, N; Pazhayattil, A.B., Doshi, C. (2017). A Novel Metric for Continuous Improvement During Stage Three, BioPharm International, 30 (6):32-35.
About The Authors:
 Ajay Pazhayattil, Ph.D., is a seasoned management consultant and an industrial pharmacist with experience in the industry’s solid oral, sterile, and API sectors. He is the founder of cGMP World and a partner at Itaan Pharma, an injectable manufacturer. He has been in leadership roles with North American pharmaceutical brands, generics, and CDMOs, including the VP of scientific and regulatory affairs at Capcium, the quality director at Eurofins, and the TO-PV associate director at Apotex. Pazhayattil plays a crucial role in assisting organizations in navigating remediation and compliance efforts supported by sound scientific evidence. He has served as a lead author and contributor to industry guidance documents for organizations such as PDA, ISPE, AAPS, and RAPS.
 Marzena Ingram is an independent senior pharmaceutical consultant with extensive QA, technical operations, and process validation expertise. Her specialty is in navigating FDA warning letter scenarios and providing clients with regulatory-compliant solutions. She is known for strategic team leadership. She has driven PV compliance initiatives that have met global regulatory standards and has been involved in establishing industry benchmarks. Additionally, Ingram has built and led specialized teams in high-volume manufacturing settings, ensuring process validation excellence and performance. Ingram has served as VP of ISPE Canada.