
Quality Management Review — Benchmarking Quantitatively!
By Tobias Kuners of Koenders, managing consultant, Tob Management
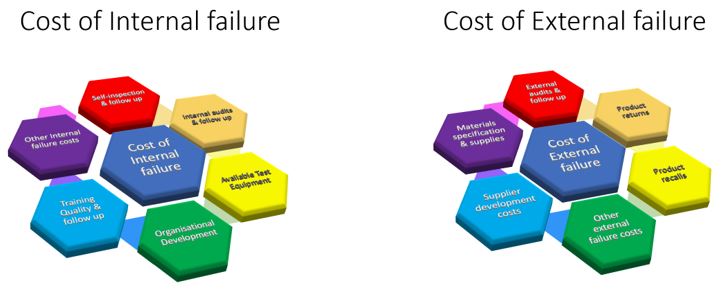
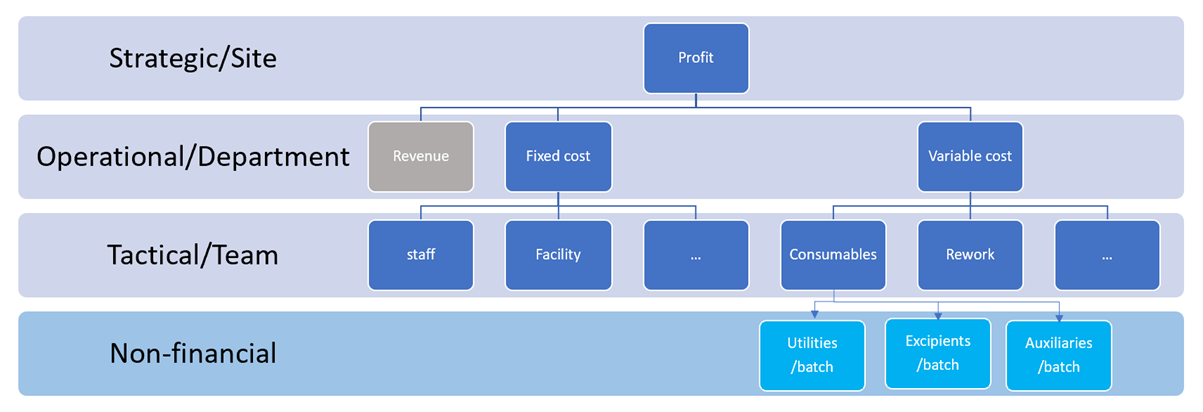
 The cost of quality is an essential theme for any corporation. Typically, when the cost of quality is pictured, it is split into “cost of quality” and “cost of non-quality,” or similarly, “cost of control” and “cost of failure of control.” At the next level of detail, the costs of prevention and appraisal appear on one side and the costs of internal failure and external failure on the other side, as shown below.

How to interpret and implement these buckets at the tactical level is often left to personal imagination.
This article proposes an integrated approach for implementing and interpreting qualitative and quantitative metrics in the GMP and non-GMP sides of the business.
Integrating Non-GMP Functions Into Quality Management Reviews
Quality management review (QMR) is the monthly meeting at the site or divisional level, with all the relevant departments active in the GMP space participating. Departments such as sales (or the customer’s project management), human resources, and financial management usually have no seat at the table of the QMR meetings. From a business point of view, this is an opportunity left unharvested This article will discuss that in more detail.
In a QMR, the topics covered typically touch upon management of qualitative internal (GMP) control; deviation management and its next level of detail, CAPA management; internal audits with their next level of detail, recommendations and observations for improvement, with the latter differentiated in three categories (minor, major, and critical); and management of external control, including product complaints and recalls and external audits.
By integrating the non-GMP management side of the business with the GMP compliance side, both sides develop understanding and appreciation for the other, leading to better collaboration and support, creating a more compliant, financially robust business.
The QMR covers the qualitative assessment of performance, and trending adds perspective on progress or improvements. Such an evaluation is a numerical representation of, among others, new, completed, and pending change controls, deviations, and CAPAs. As a means to drive conclusions, tasks from change controls, deviations, and CAPAs are grouped into those for completion in less than 30 days, between 30 and 60 days, and longer than 60 days, giving some kind of granularity.
Building Key Metrics

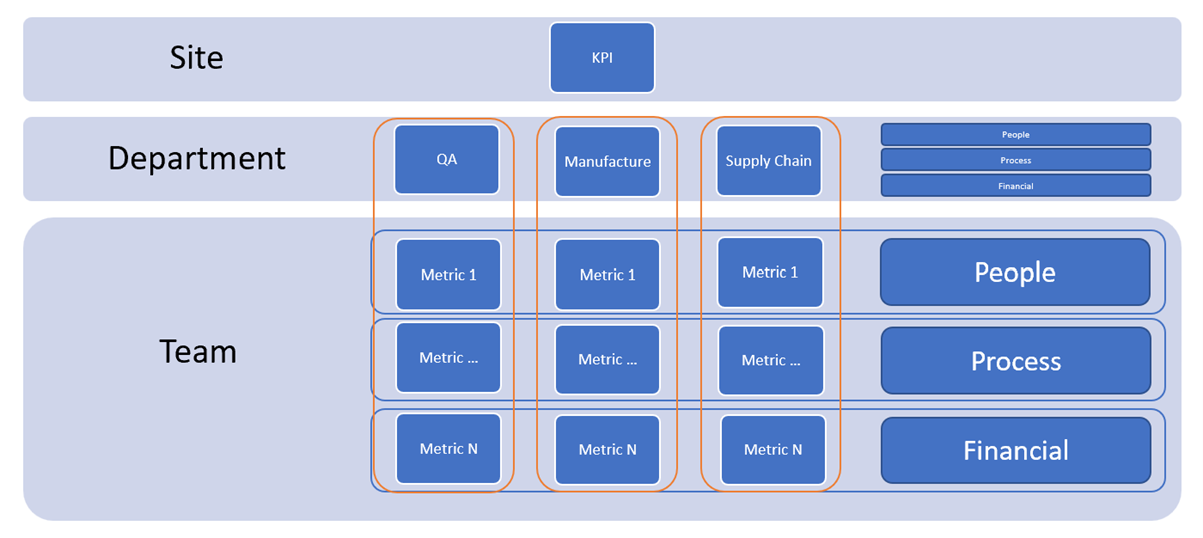
A site comprises multiple facilities, allowing for a degree of layering. Each facility has its own set of metrics at the department level. Those metrics can be merged at the facility level in the four buckets, grouped as the key metrics at the tactical level.
Alignment with the financial department (accounting) is essential. Alignment on the definition(s) of the metrics and the cost centers in the ERP system needs to be seamless to allow easy reporting. A defined list of cost centers makes up a metric, and a series of metrics make up a key metric. By doing so, quantitative metrics of performance join with qualitative indicators.
For example, the cost of prevention is a key metric, with the underlying series of metrics including planning, process control, quality training and workforce development, quality engineering, systems development and management, and, of course, “other prevention costs.”
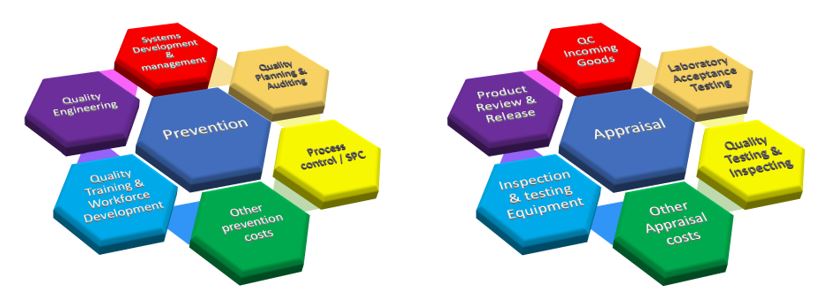
Appraisal cost is the other key metric, encompassing QC incoming goods, laboratory acceptance testing, quality testing and inspecting, inspection and testing equipment, product review and release, and “other appraisal costs.”
The financial management system has defined cost centers for prevention and appraisal costs and for internal and external failure costs, as well; otherwise, these need to be defined.
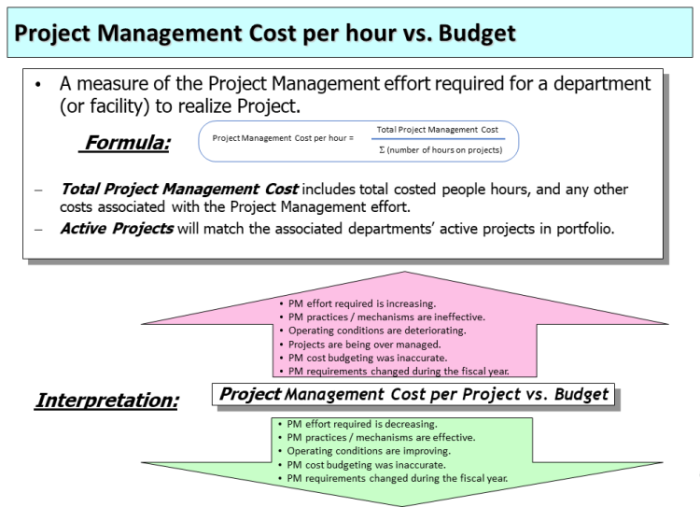
For each of the metrics, clear definitions need to be drafted to allow sharing across teams, departments, facilities, sites, and divisions, creating comparability and alignment. The comprehensive format shown above provides metric title, description, formula, interpretation, and an explanation of (some of) the underlying reasons why the value rises or falls from the target. Together with color coding, it helps show the desired direction of movement for the target value.
Monthly reporting of the financial and non-financial metrics allows for a meaningful departmental meeting. Converting into quarterly site-level reports allows for comparison and possibly healthy competition. Reporting performance of compliance with GMP-relevant metrics, combined with financially meaningful metrics in the QMR, allows for razor-sharp focus on compliance, the business impact as priority lever, and the return-on-resolution the reward.
Push Vs. Pull Systems
Measuring, collecting, reporting, and reviewing is the recurring loop of Plan, Do, Check, and Act. That process needs to be in place and it must work autonomously. Functioning autonomously means that the process operates as a push system; the organization wants to report its performance and recommendations because it is empowered to act with endorsement. This is contrary to a pull system in which the organization is required to report performance through fear of punishment.
Further buy-in of such a system, all the way to shop floor participation, is made through conversion of financial metrics as reported by the enterprise computer system (ERP system) in non-financial quantitative metrics that are within the realm of control of staff at the shop floor.
Such non-financial quantitative metrics come from shop floor check-sheets, master batch records, inspections, and calibration reports and give technicians insight into the degree of control over their work. The most significant chance for success when implementing these enhancements comes when they are set up as a push system, as the operators and technicians at the shop floor will want to report their performance and recommendations because they are empowered to act with endorsement.
Being empowered to act with endorsement means an organization has a process to propose recommendations that allows for assessment against agreed-upon and approved stage gate criteria, without direct involvement of senior management.
Making a switch from financial to non-financial quantitative metrics also transitions from tracking lagging indicators to leading indicators. Lagging indicators report after the fact, while leading indicators show the way toward the goal. Project management cost reported at the end of the month is sunk cost that cannot be recovered. Tracking daily project management hours allows for (timely) adjustment or even changes to meet budgetary targets and other goals during the month. Similarly, variable costs per batch reported at the end of the month are incurred costs that cannot be recovered; however, reporting daily use of consumables makes it possible to track their cost and adjust as soon as consumption exceeds (self-set) targets. Confirmation is provided with the monthly report when the QMR reports what the metrics have been showing throughout the month.
Benchmarking Efficiency And Effectiveness
Benchmarking occurs when our own performance is compared against the standards set by the best-in-class. Best-in-class does not necessarily refer just to our own industry. For instance, transactional tasks such as accounts payable or comparable ones, likely are performed most efficiently and effectively by financial corporations such as MasterCard or Ayden Payment Services. Sharing such metrics between non-related industries not only drives performance par excellence, but it also allows for transparency as the businesses are not in direct competition. Sometimes, comparison is not readily available, as with batch record review; in these cases, internal standards need to be developed. This is done over time but can start with setting an achievable but challenging goal. As an example, for batch record review, setting 4 hours and allowing for a turnaround time of five working days allows for quality review and provides flexibility within the review team to schedule the work. Over time, verifying the actual review and turnaround time against the self-imposed benchmark allows for adjustment to become more realistic if needed or more challenging where possible.
One common pitfall in benchmarking is making too many metrics key and tracking too many of those at the site level or divisional level. With too many metrics at the site or divisional level, the conversations around metrics that are out of range are too shallow given the limited time available during the QMR meetings.
The recommended strategy is to use key metrics to roll up an array of metrics, as in a key metrics tree, and match the metrics with review cycles with appropriate intervals at the different levels in the organization – teams, departments, facilities, sites, and divisions. When a key metric is in control, there is no need to discuss it, and time remains to address those metrics that deserve focus. If a key metric is not in control, the underlying metrics need to be shared and the conversation focused on addressing the off-spec metric. In the proposed structure and format, all that information is available.
Most processes can work with just a couple of key metrics, as long as each metric considers both its effectiveness and its efficiency aspects. Effective is doing the right thing; efficient is doing the thing right. Again, as an example, batch record review is effective with a high pass-rate on right-first-time (RFT) and efficient when it has a review time and turnaround time as in the example mentioned earlier.
There is a nice catch here that may not be obvious at first sight: for QA to report (i.e., score) a high pass-rate on RFT, it is essential for manufacturing to hand over the batch record on time, in full (OTIF), which means that manufacturing delivers the batch record to QA in the agreed-upon time slot of a specific day, and with all necessary detail entered. Here is where metrics assist in building mutual understanding and driving collaboration within and between teams and departments. For this reason particularly, it is important to consider the efficiency and effectiveness of every metric. Efficient is within the team, department, or site, while effective is between teams, departments, or sites. If metrics are only efficient, this builds an organization of silos. Metrics that are only effective produce an organization that has high throughput of undefined quality.
With support of finance, the monetary benefit of hitting – or the expense of missing – target values can easily be shown. For manufacturing to produce good product, it is paramount that it delivers batch records OTIF, not always immediately. For finance to invoice the client for product delivered, it needs a signed-off batch record, which QA provides when manufacturing has filled out the batch record accurately, completely, and in timely fashion. By providing this financial angle on compliance, it becomes more clear where and when focus is needed and how unnecessary costs can be avoided. Here, three different departments benefit from an efficient process carried through effectively. With an ERP system, setting up these processes and structures is a little bit of work. Once in operation, reporting is just a few keystrokes.
From another perspective, for sales (customer’s project management), it similarly can be made apparent what load-levelling brings; pristine planning and flawless execution at 80% project loading may be more profitable compared to rushed planning with haphazard execution at 110% loading.
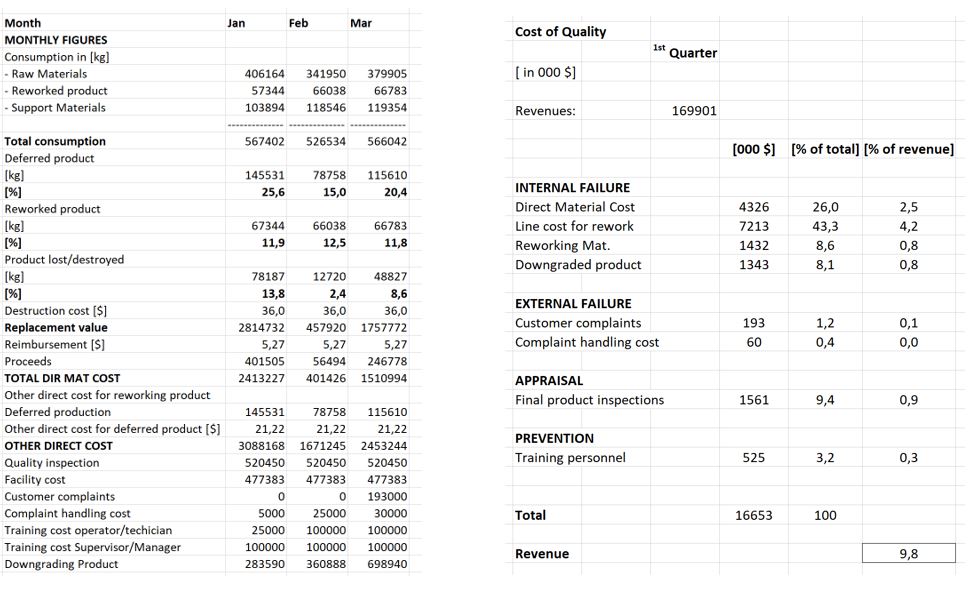
In this sample overview of the first quarter, it can be seen that the line cost for rework is 43.3% of the total cost of quality, and prevention is only 3.2%. With a noticeable increase in training, line cost for rework can be reduced significantly. The reduction of line cost for rework will outweigh the increase in training cost, making it overall favorable for the business. Seeing the total cost of quality as a percentage of sales reduced from the initial 9.8% as a consequence of deliberate actions and business-wide collaboration is a boost for teamwork.
Enhancing and fine-tuning the four categories of cost of quality is a continuous process but should not be done every quarter. Consistency in reporting and trending alone will provide much insight and opportunity for improvement without elaborating the categories each time. Setting more challenging but achievable targets for metrics is the more appropriate way to stimulate continuous improvement. When metrics do not change over time because they hit a plateau, it is time to replace them with ones that contribute to business success by showing improvement over time.
About The Author:
Tobias Kuners of Koenders is managing consultant at Tob Management, a Netherlands-based consulting firm providing business and technical expertise to the pharmaceutical, biotech, medical device, and FSMP (food for special medical purpose) industries. He has worked with Biogen, Ipsen, Thermo Fisher, Kite Pharma, and Danone, among other companies, gaining hands-on experience in engineering services, equipment qualification, maintenance, supply chain, warehousing, and distribution. He has led design, engineering, and construction of multiple facilities to meet cGMP requirements. He performs audits, identifies gaps, and develops remediation plans, working within organizations to assist with deviation investigations and CAPA implementation and to develop scientific, risk-based solutions. You can contact him at tobias.kunersofkoenders@tobmanagement.nl.