
Process Mapping For More Effective Knowledge Management
By Irwin Hirsh, Q-Specialists AB

The first article of this series presented the business case for knowledge management (KM). This article presents a mapping methodology for identifying and organizing process knowledge as part of KM. Examples from quality risk management (QRM) and biologics process development will be presented.
Biotechnology is a knowledge-driven business, which for decades has relied on SMEs and tacit knowledge sharing to move projects forward. By and large, this has sufficed. However, as baby boomers retire, being in one role for three to four years now makes a team member an “old-timer,” and it becomes imperative for a business to make operating process knowledge explicit and easily accessible to the people performing the standard work. If this does not happen, SMEs will waste time firefighting and performing basic training. This waste of talent puts projects at risk for gaps in performance, lowers development team productivity, and stifles innovation.
When proper knowledge management is part of a business, chaos is reduced, and a VUCA world (one with volatility, uncertainty, complexity, and ambiguity) for your business is neither inevitable nor are its elements insurmountable when they occur. Operational platforms are an excellent example of how knowledge management can be used to bring clarity and, thus, operational benefits. Platform knowledge allows complex processes and systems to be broken down into a series of simpler well-defined tasks with known unknowns and awareness of volatility, that is, trade-offs that come with decisions.
Mapping To Create Process Knowledge
Herein the focus is on creating clarity and understanding on how to run the tactical, operational business processes through knowledge management. Therefore, strategic process-oriented tools like value-stream mapping (VSM), whose purpose is to identify and eliminate waste in the end-to-end process, are out of scope.
Distinct aspects of process knowledge and understanding can be gained from the many different types of process mapping tools. For example, in an analytical lab, spaghetti mapping of a worker’s movement, from sample storage to sample prep to solution making and then to the analytical device, provides knowledge of opportunities to improve productivity and reduce injury. However, it reveals nothing about the capability of the methods to deliver meaningful and compliant analyses. Therefore, a patchwork of knowledge from multiple complementary mapping tools must be used to generate the process knowledge required for business success.
![]()
Figure 1: Spaghetti diagram of movement through an analytical laboratory
The Power Of Visual Information
Consider the “you are here maps” at shopping centers and hiking trails. There is a great comfort in knowing where you are. Additionally, knowing where you are going and how to get there is a great confidence booster. Process mapping provides this comfort and courage to the personnel.
Visual information can provide a clear and concise representation of each step; thus, complex processes can be simplified. This reduces the chances of misinterpretation (errors) and increases the likelihood of success. Visual instructions also minimize the reliance on written or spoken language, making them suitable for a diverse audience with varying language proficiencies or different cultural assumptions.
Business Process Model and Notation (BPMN)![]()
Figure 2: The most common shapes used in business process mapping and their meaning. “Review Cycle” was constructed by the author to support process mapping for a review heavy regulatory compliance process. It is essentially a specific case of a “Decision” diamond and is left in simply to show that variants may increase visual information transfer.
If you have ever selected the Insert > Shapes dropdown menu in a word processing, spreadsheet, or drawing program, you will universally find the cluster of shapes used in BPMN. This is a 21st century convention maintained by the Object Management Group, a computer industry standards consortium. Use of this standard notation enables more knowledge sharing more quickly to more persons.
Getting Started Mapping Business Processes
As hinted above with the spaghetti mapping discussion, there are a multitude of mapping techniques one can use to explore business processes. In general, start with a high-level process flow map. Do not be afraid of starting at an overview level before diving down into details. This stepwise approach usually takes little extra time and can help to rapidly align understanding and assumptions about the scope of and/or way of working in a non-adversarial manner. Once your mapping team is aligned, a deeper dive into sub-steps will go much more quickly.
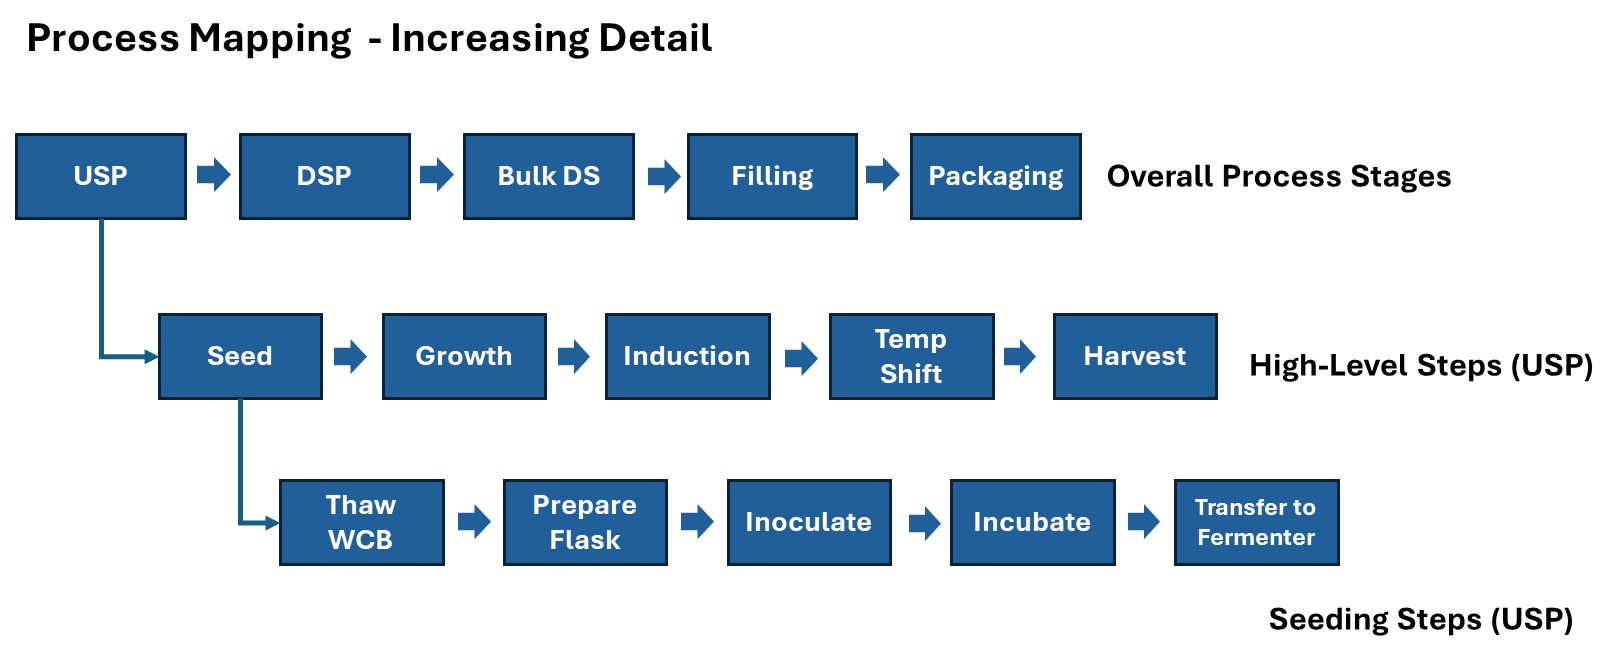
Figure 3: Two levels of process mapping for USP. USP = Upstream Process, DSP = Downstream Process, DS = Drug Substance, WCB = Working Cell Bank
Normally, one must go three levels deep into sub-steps to identify significant process knowledge, or its absence. Figure 3 above shows an overall process map for a typical bioprocess from upstream to packaging and then a two-level “drill-down” into part of the upstream process.
Always remember: The process experts are those who perform the process on a regular basis. Their absence on the mapping team puts the work at risk of becoming an academic exercise with no operational value.
The Right Tools
A well-defined business purpose must drive the selection and prioritization of process mapping work. Once the business purpose and knowledge gaps have been defined, the right tools can be selected.
The following is a brief description of three additional mapping tools: swim lanes, SIPOC, and knowledge mapping. The knowledge output from these techniques both complements and relies upon the knowledge generated in the process flow maps discussed above in Figure 2. Examples from QRM and biologics development will follow to provide details and context.
| Tool & Knowledge Revealed | Major Benefits to the Process Users |
|---|---|
|
Swim Lane |
By clearly delineating the responsibilities and identifying the handoffs between departments, potential bottlenecks in the workflow, usually at the handoffs, can be identified and removed. |
|
SIPOC |
SIPOC helps align the timing and type of work done with the expectations of those who receive it as their input. |
|
Knowledge Mapping |
This information can be used to identify knowledge & knowledge gaps, locate expertise, and facilitate knowledge sharing: work instructions and training in process execution. |
Table 1: Common mapping tools and their use in knowledge management
Mapping Examples
The following examples will provide clarity on how to overcome two operational challenges within process development:
- how QRM elements for development can be achieved through integration into business processes and
- how different mapping techniques provide different insights into the knowledge required to perform these processes.
| Acronym | Definition of QRM Elements |
|---|---|
| TPP | Target Product Profile |
| QTPP | Quality Target Product Profile |
| CQA |
Critical Quality Attribute |
| CPP | Critical Process Parameter |
| CCP | Critical Control Point |
Table 2: QRM Knowledge elements essential for development
To properly create and/or manage the knowledge generated via QRM, we must integrate these elements into our operational processes. Too often, they simply become a list of deliverables in a development project, which they are; however, in the absence of process integration and a systematic approach, the project team suffers:
- lack of clarity on who is responsible to deliver what when and
- a dearth of instructions on how to create and document the requisite knowledge.
This leads to incomplete and variable process knowledge and knowledge sharing within and between projects, adding to project risk and potentially putting the CMC development on the critical path for product launch. Figure 4 below maps the integration of the QRM elements into business processes.
![]()
Figure 4: Integration of QRM elements into business processes. CMC = chemical manufacturing and control; COGS = cost of goods sold; pCQA = potential CQA; NOR = normal operating range; C&E = cause and effect. Critical control points (CPP) are not shown. They are defined in the control strategy and would appear in a more detailed mapping.
In Figure 4 the high-level map can be read vertically down on the left of the blue dotted line. A level-1 mapping for each step in the high-level process is shown on the horizontal after each high-level step.
This top-level mapping provides a common baseline reference for defining the QRM elements during development. However, it alone is insufficient to close knowledge gaps among project teams who will require:
- clarity on who is responsible to deliver what when and
- work instructions, tools, and templates that standardize the creation and documentation of the QRM knowledge.
Let us now look at how we can create the knowledge necessary to close these gaps with the other mapping tools described above in Table 1.

Swim lanes mapping
Each "lane" represents a specific role or department and visually depicts the steps of a process across different functional areas or individuals. As you can see in Figure 5 below, product definition is the shared responsibility of three different departments (lanes) and there is clear dependency on a flow of information back and forth between departments to create the output of the process, the QTPP.

Figure 5: Product definition process — Swim lanes mapping of QRM outputs from the business case
Swim lanes and hand-offs
In addition to the knowledge of who must do what and when, swim lanes mappings provide insight into “hand-offs.” Hand-offs occur when information and other outputs become the critical inputs to the next step in the process.
What makes this visual representation of hand-offs so helpful in closing process performance gaps is that the physical act of creating this information requires that all parties involved acknowledge the hand-off and begin a discussion about expectations on inputs and timing.
Figure 5 shows that two items, a document (QTPP template) and a process step (COGS modeling) are on the border between two departments. This indicates that there is likely no clear ownership for the template and lack of clarity on how to keep the COGS model relevant. It is at hand-offs, especially hand-offs like these two, where there are sure to be issues in performance due to poor knowledge management.
Ideally, these issues, once obviated, will release time and resources for a deeper dive into the “how to” process knowledge required to perform the work as agreed upon.
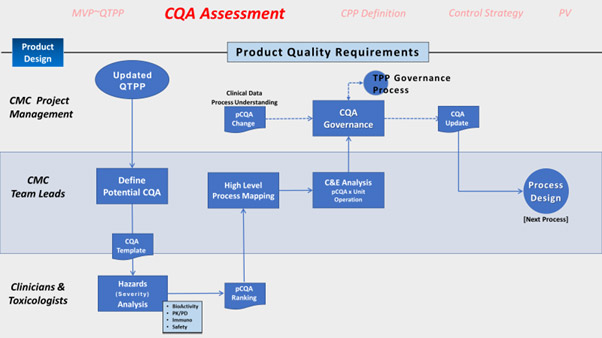
Figure 6: Definition of critical quality attributes of the product (CQA)
Process maps also serve a longer-term function. As can be seen in Figure 6, the CQAs link back to the TPP Governance defined in Figure 5. This interdependency — if well understood and controlled — results in CMC project teams building a product that is not only safe and effective but capable of delighting the customer and hitting all business targets.
By embedding these maps into our documentation and training we create a simple, clear visual tool that keeps the awareness of this interdependence alive for the duration of a development program. Thus, it de-risks the impact of changes to the product requirements due to new clinical data or business goals by ensuring that they are likely to be built into the process.
Note: In the example given here, only critical-to-quality (CTQ) product attributes are explicit. Therefore, it is important to note that, very often, critical-to-business (CTB) and (CTQ) product requirements overlap. Where they do not, a parallel process could be created or perhaps, more practically, they could be rolled into the CTQ processes and simply designated as CTB-only.
With the knowledge gained from swim lanes mapping, one can easily build up RACI tables. As shown above, the lanes reflect department responsibilities. On a micro level, the CMC project team can create swim lanes mapping for each team member to develop a RACI table for complex tasks within a project.
SIPOC mapping will also provide knowledge of who does what and when. However, it is a more text-driven approach to process knowledge. A SIPOC mapping for document review follows below.

Figure 7: SIPOC map for technical document review of working cell bank (WCB) manufacture. GMP = good manufacturing practice, CMC = chemical manufacturing and control, R&D = research and development, CDMO = contract development and manufacturing organization.
SIPOC mapping
A SIPOC map provides clarity on high-level processes by showing the big picture of the process without going into too much detail on the process steps. SIPOCs are often created to scope and structure processes. SIPOC shines when one needs to rapidly identify the critical process elements and main stakeholders. Detailed process maps provide details into how the process works but are more complex and time-consuming to create and maintain. SIPOC mapping, while less detailed, rapidly provides valuable process knowledge even if only the high-level steps are known.
From the SIPOC information in Figure 7, we now have a priority list for document control and workflow creation, and we can create a RACI table. Additionally, the persons, or at least the functions required to support a detailed process mapping, have been identified.
In Figure 7 we see the BPMN process steps, in dark blue across the top, for a simple document review workflow. They are repeated in the middle of the SIPOC. This SIPOC is a specific case of document review in which the batch records for a working cell bank created by a CDMO are to be reviewed. This workflow could be repeated for all sorts of technical reviews and the template, once filled out, would enable an automated (digital) workflow to be created for each type of review.
Knowledge Mapping The “How-to” Knowledge
From the different process mapping tools presented above, one can envision a process knowledge journey in which:
- BPMN process mapping provides the process knowledge for a workflow,
- SIPOC and swim lanes mapping provide the knowledge of who must do what when, and
- detailed process mapping provides details on the process activities.
To complete this process knowledge journey, we now need to map the specific knowledge of how to perform the process. This knowledge is revealed through knowledge mapping, a process of visualizing and structuring information within an organization to identify, categorize, and understand the distribution of and gaps in knowledge. It helps create a structured representation of explicit and tacit knowledge, enabling better management, sharing, and utilization of information.
We can apply this approach to our process knowledge journey by applying the line of questioning shown in Figure 8 to each activity (sub-step) in a process step.
| Process step activity | What knowledge is required | Who owns this knowledge | Tacit or explicit knowledge | Where is this knowledge | Who can validate this knowledge | Assess the knowledge gap (1-5) | Additional information and tools |
| An activity within that step | List the knowledge required to perform the activity | List the sources, eg., SOPs, persons, shared folders | Is it inside someone's head or written down? | List locations or people who have the knowledge | List persons or systems used to verify truth | The current knowledge versus the level needed for success | Context For scoring and gaps in relevant knowledge |
Figure 8: Line of investigation for creating a knowledge map
Knowledge mapping is a hugely beneficial tool and the knowledge revealed by answering the questions in Figure 8 for each process action/sub-step is ideal for building job descriptions, competency and training matrices, process aids, and project onboarding packages. The bulk of the knowledge that has long been held in people’s heads becomes explicit knowledge suitable for digitization and learning. SMEs are identified, and important tacit knowledge can be delivered in timely hands-on training.
Knowledge gaps identified can become priorities or the rationale for a pivot in some higher-level strategy, such as, for example, outsourcing the creation of cell banks because of the time and expense required to build the in-house knowledge and staff required to perform this task. By investing the time to map one’s processes, a competitive advantage is gained.
Knowledge Mapping Of Platform Processes
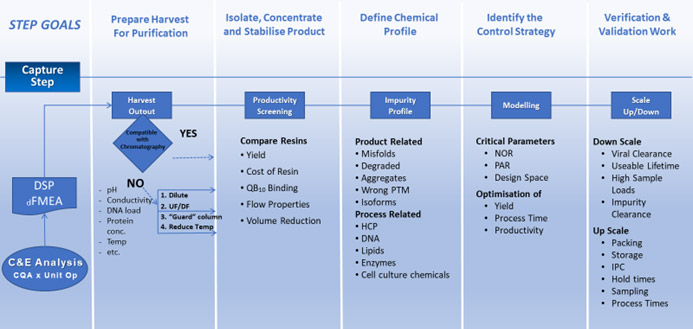
Figure 9: Implicit knowledge of CiPP approach to downstream processing steps. Made explicit for the "C" capture step. [CiPP = Capture, intermediate purification, polishing]
In Figure 9, we are presented with platform knowledge on a process map. Each step in the process, the capture step process, is accompanied by a wealth of knowledge. Across the top are the “step goals” and below each step there is a list of topics to be investigated to achieve each goal.
Platform knowledge is very helpful in accelerating the process of development because of the inbuilt knowledge and the known trade-offs associated with choices when they occur. Mapping the platform knowledge is a fast-track means for creating the detailed “how to” knowledge needed to reduce time to competency in staff and ensure that standard work follows the standards.
Too often, this knowledge remains implicit. That is, it is known only by those who have significant experience with the platform and its associated systems. When these individuals leave, a wealth of knowledge leaves with them; this need not be so if knowledge is managed.
Knowledge Mapping And Digitization
This article presents an outline of the knowledge mapping journey and requisite tools. Once your company or department is well along the path to making its process knowledge explicit, the opportunity to standardize and digitize can be realized.
Digitization of knowledge accelerates the performance of tasks by eliminating delays and errors due to problems related to knowledge sharing. Digitization of knowledge also creates a strategic advantage. Organizations can use knowledge maps to answer strategic questions about knowledge management and align knowledge assets with strategic objectives, thus ensuring that knowledge initiatives (e.g. mapping efforts) support overall business goals.
The next article of this series will present approaches and tools for the digitization of process knowledge for CMC development processes, including QRM.
About the Author:

Irwin Hirsh has nearly 30 years of pharma experience with a background in CMC encompassing discovery, development, manufacturing, quality systems, QRM, and process validation. In 2008, he joined Novo Nordisk, focusing on quality roles and spearheading initiatives related to QRM and life cycle approaches to validation. Subsequently, he transitioned to the Merck (DE) Healthcare division, where he held director roles within the biosimilars and healthcare business units. In 2018, he became a consultant concentrating on enhancing business efficiency and effectiveness. His primary focus involves building process-oriented systems within CMC and quality departments along with implementing digital tools for knowledge management and sharing.