
Mammalian Biomanufacturing Industry Supply & Demand Trends
By Dawn M. Ecker and Patricia Seymour, BioProcess Technology Group, BDO USA

Since the approval of the first recombinant therapeutic antibody, OKT3, in 1986, mammalian-based biopharmaceutical products have become a larger percentage of overall pharmaceutical company revenue. In 2019, the sales of the top five selling recombinant proteins (Humira, Keytruda, Eylea, Opdivo, Avastin), all antibody-based products, totaled just over $52 billion. The compound annual growth rate for antibody product revenues, which include naked monoclonal antibodies, Fc-fusion proteins, antibody fragments, bispecific antibodies, antibody conjugates, and other antibody‑related products, was approximately 20% from 2004 to 2014. However, this growth has slowed to the mid-teens in recent years due to the maturation of many products and emerging alternative therapeutic modalities. Also, it is difficult to sustain such growth rates as the overall market size increases.
To provide context around this growing segment of the pharmaceutical market, BPTG’s proprietary bioTRAK database of biopharmaceutical products and manufacturing capacity estimates that there are nearly 1,600 biopharmaceutical products in some stage of clinical development in the United States and Europe. The majority of these products, approximately 85%, are produced in mammalian cell culture systems. We evaluate the distribution of mammalian products by product type and phase of development to further refine the biopharmaceutical manufacturing market. Figure 1 shows the distribution of product types, including antibody products, blood proteins, cytokines, enzymes, fusion proteins, hormones, and other recombinant proteins, by phase of development. Antibody products are the dominant commercially marketed product type at nearly 60% and are the largest product type for all phases of development, with the early-stage pipeline consisting of nearly all antibody products. It is important to note that many of the early commercial biopharmaceutical products, such as growth hormones, insulins, and interferons, are produced in microbial systems.
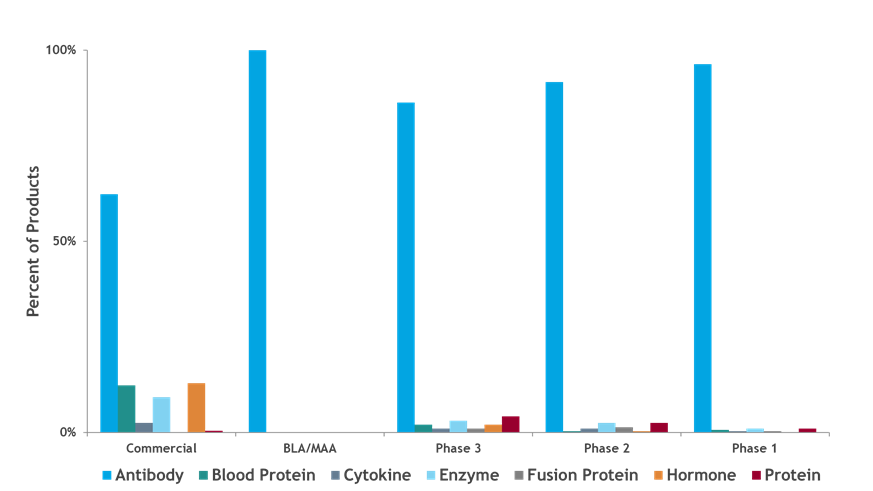
Figure 1: Distribution of mammalian products by product type and phase of development
Whether commercially approved or in development, each of these products needs access to mammalian production capacity. For current commercially approved biopharmaceutical products, the future demand is estimated from each product’s reported annual sales data, along with estimates of each product’s future growth rates. Our future product growth estimations take into consideration a product’s age, as sales growth typically slows as a product matures, while newly approved products often do not reach full market penetration for several years.
The projected treatment population size is estimated based on price per milligram and sales. Combining the population with the yearly per patient dosing, we forecast the kilogram quantities required to meet the demand for each product for the next five years. These kilogram quantity forecasts can be converted to liter quantities for each product using cell line expression levels and overall purification yield estimates. These estimates are based on industry benchmarks at the time the product was being developed and the maturity of the company developing the process. For example, the commercial process for a product launched more than 10 years ago will likely have a lower expression level assigned in our forecast algorithm than a product currently in clinical development. For products in development, future commercial demand is estimated based on the market penetration of currently approved products or proxy products with similar indications. Additionally, for products in development, we employ a phase-based commercialization probability assumption when calculating future demand.
Figure 2 shows the projected kilogram quantities of product needed to meet annual commercial and clinical demand for all product types produced using mammalian production systems. In 2019, nearly 30 metric tons of product were required. As more products enter the pipeline and products in development receive commercial approval each year, the overall kilogram requirements needed to meet product demand increase from nearly 30 metric tons in 2019 to nearly 60 metric tons in 2024. Demand for coronavirus disease (COVID 19)-related products are not included within the typical forecast, which is shown below.
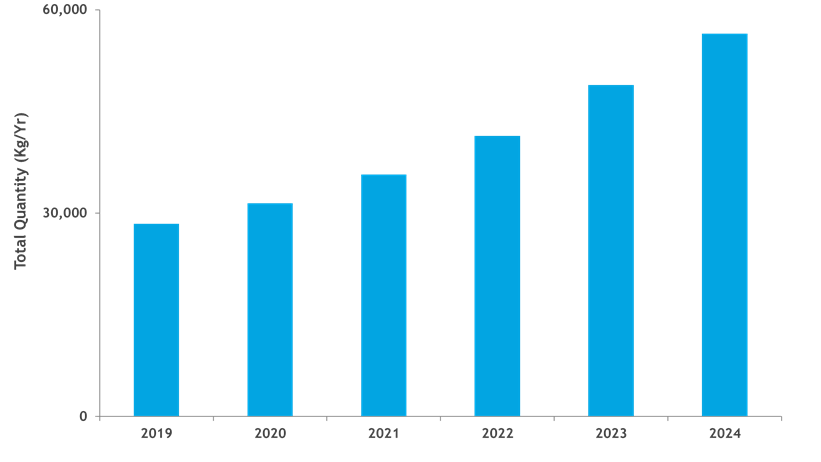
Figure 2: Estimated quantity of bulk kilograms needed to meet product demand
Figure 3 shows the projected volumetric capacity needed to meet annual commercial and clinical demand for all product types produced using mammalian production systems. In 2019, the annual volumetric requirements were just over 2,600 kL, while in 2024, the volumetric requirement is projected to be nearly 4,700 kL, a five-year growth rate of 12%. Volumetric demand for COVID-19 related products is not included within the typical forecast, which is shown below.
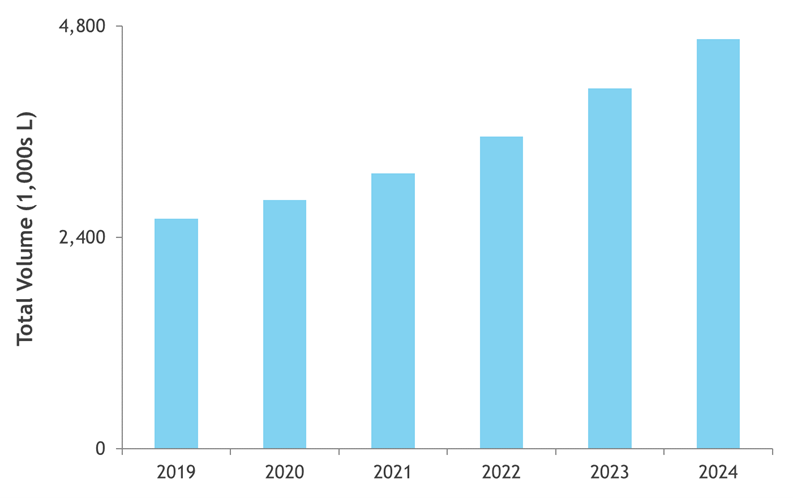
Figure 3: Estimated volumetric capacity needed to meet product demand
As with any forecasting model, our assumptions for a typical year are based on the most probable scenarios and include estimations for biopharmaceuticals that are being developed for certain large patient population indications such as Alzheimer’s disease or broad cancer treatments like PDL/PDL-1 checkpoint inhibitors. Should several of these large-demand products obtain regulatory approval and adequate reimbursement by healthcare oversight organizations (i.e., U.S. Pharmacy Benefit Managers, the U.K.’s National Institute for Healthcare and Excellence (NICE)) or become part of a managed entry agreement between a company and public payer of a social or national health insurance system, a significant increase in demand for manufacturing capacity could occur, potentially leading to a serious capacity shortage.
In addition to the products being developed for typical indications, this year we face an additional challenge of incorporating demand for recombinant proteins being developed to combat the COVID‑19 pandemic. We have begun to track novel and repurposed products being developed to treat active cases of severe COVID‑19 related symptoms. Additionally, we are tracking several novel antibody-based products projected to be used as potential COVID‑19 infection preventives, although there remains a debate over just how significant a role any antibody treatment might play in preventing COVID‑19 infection.
Conversely, there are other manufacturing trends that could result in a decrease in demand for some biopharmaceutical manufacturing capacity. Among these are the industry’s increased focus on orphan indications, a shift from full-length naked antibodies to alternative antibody formats and more potent products (e.g., antibody drug conjugates (ADCs) or bispecific antibodies) that would require lower doses. Given the projected increase in volumetric demand over the next five years, the industry is cognizant of the inherent volatility of production capacity forecasts. There is always a degree of uncertainty in balancing the demand and supply equation due to production problems, market demand fluctuations over time, regulatory and reimbursement issues, and competitive factors.
To understand how the industry is positioned to meet these product demands, we estimated the 2019 mammalian cell culture supply to be approximately 4,700 kL and predict it to grow to nearly 6,500 kL by 2024, a five-year growth rate of 6.4% per year (Figure 4). However, not all capacity is equally available throughout the industry. In 2019, product companies, i.e., companies focused on product development, controlled nearly 70% of the installed mammalian cell culture capacity, while hybrid companies, i.e., companies that are developing products but also sell or make available any excess manufacturing capacity, and CMOs controlled significantly less capacity. The distribution of capacity changes slightly in 2024, with product companies controlling nearly 65% of the installed capacity, while CMO capacity increases 3% and hybrid companies remain stable.
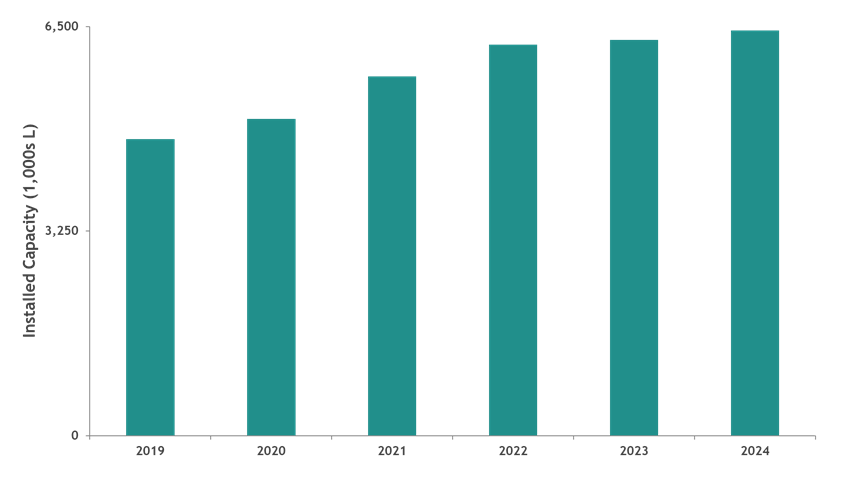
Figure 4: Mammalian manufacturing capacity
While product companies control the majority of cell culture capacity, the distribution of this capacity is highly concentrated within 10 companies, as shown in Table 1. Capacity for companies not ranked in the top 10 is distributed among nearly 130 companies in 2020 and nearly 135 companies in 2024. Currently, over 60% of the capacity is controlled by 10 companies; in 2024, this changes to less than 60%. Based on substantial capacity investments, WuXi Biologics and Celltrion will displace Bristol Myers Squibb and Regeneron Pharmaceuticals from the top 10.
Table 1: Control of Manufacturing Capacity
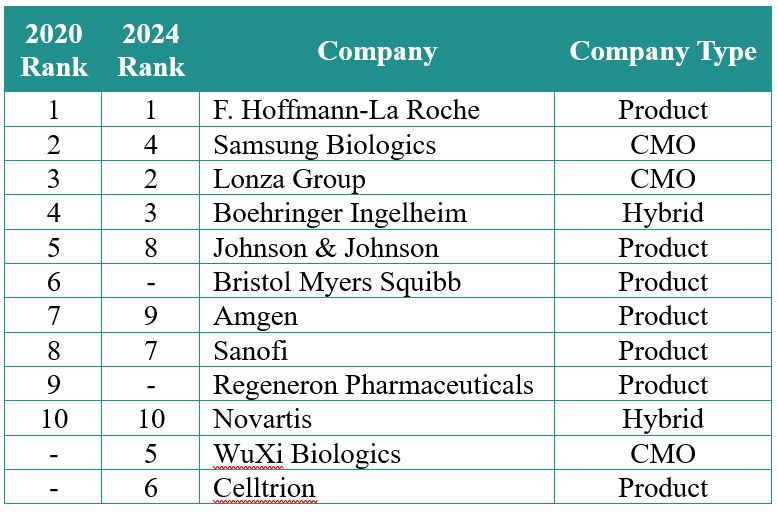
Figure 5 shows the geographic distribution of the manufacturing facilities. In 2019, nearly half of all mammalian capacity was located in North America, followed by Europe and Asia. Over the past five years there has been modest capacity growth in North America and Europe, with significantly greater growth in Asia. By 2024, with significant growth rates projected in Asia (~7%) and Europe (nearly 12%), North America and Europe will have equivalent capacity. The capacity growth in these areas, particularly in Korea and Singapore as well as Ireland, is likely due to government incentives and tax advantages, among other factors.
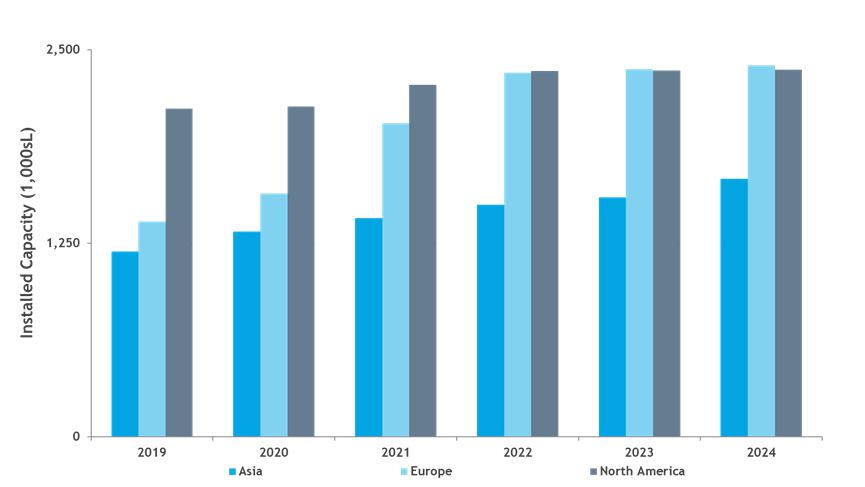
Figure 5: Geographic distribution of capacity
As described earlier, different products require different capacities. For example, the 2019 kilogram demand for the top five selling antibody products totaled approximately 4.4 metric tons. The demand for the more than 100 remaining marketed antibody products combined was approximately 20 metric tons (an average of ~200 kg each, the median 48 kg). For products still in development, in a best-case commercial scenario where market success and maximum market penetration are assumed, projected demand for approximately 60% of these products in development is expected to be less than 100 kg per product per year. Only 8% of the products, such as those for Alzheimer’s disease, Parkinson’s disease, diabetes, and possibly some coronary heart disease or atherosclerosis products, are projected to require over 750 kg per year. For COVID‑19 products, if we conservatively estimate that half of the patient population with severe COVID‑19-related symptoms and half of those qualifying for potential COVID‑19 preventive treatments receive a gram or multi-gram dose per patient, respectively, the kg demand for these products could require approximately 30 metric tons.
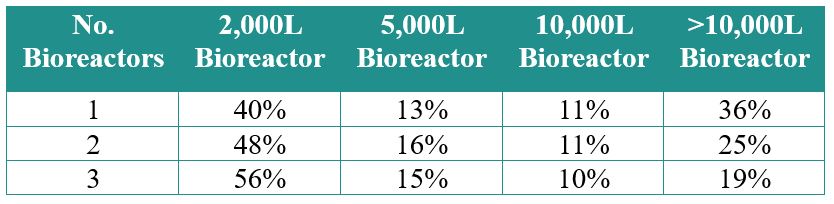
A closer review of future projected commercial manufacturing demands for products in Phase 2 and Phase 3 clinical development reveals half of the products can likely be met with a single 2,000 or 5,000 L bioreactor, assuming 18 batches per year per bioreactor with a 90% success rate for batch manufacturing (Table 2). However, this does not mean that large-scale capacity is no longer needed. Our model predicts that the remaining half of products will need bioreactor capacity of 10,000 L and greater to meet the forecasted demand. Increasing the number of bioreactors increases the manufacturing capacity and, not surprisingly, causes a shift in the percentage of products whose development can likely be met. As an example, a single 2,000 L bioreactor is capable of manufacturing 39% of the products in Phase 2 and Phase 3, while a trio of bioreactors at this scale would be capable of manufacturing over half (54%) of the products in development. COVID‑19 products will undoubtedly require multiple large-scale bioreactors to meet even a modest demand.
Table 2: Percentage of Product Demand Met by Bioreactor Scale
If we analyze the cumulative number and scale of bioreactors coming online between 2019 and 2024 at the <2,000, 2,000, 5,000, 10,000 and >10,000 L scale (Figure 6), it is evident that more than half of the bioreactors projected to come online are 2,000 L. Nearly 20% of the bioreactors are at a scale of 10,000 L or greater. While manufacturers understand the capacity demand scenarios and are installing capacity to meet these anticipated demands, it is certain that the potential demand for COVID‑19 treatments will add significant pressure to manufacturing networks with large-scale capacity.
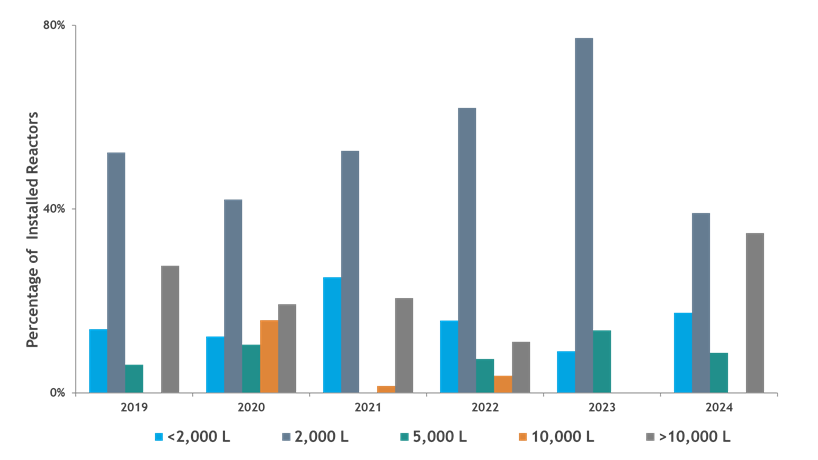
Figure 6: Percentage and scale of future bioreactors
Overall, the biopharmaceutical industry will continue to have strong growth for the foreseeable future, and antibody products will be the dominant driver of this growth. Installed capacity is currently able to meet the typical manufacturing demand for these products, but control and location of capacity can affect accessibility. The majority of capacity is product-based, rather than CMO-based, which could make it difficult for companies without capacity to access it at the right time and under the right terms.
While capacity will increase over the next five years, demand for capacity, pandemic aside, will increase at a slightly faster rate, allowing for some short-term loosening of capacity constraints, but after 2024, capacity tightening may occur. In recent years, we have noted that the industry was experiencing some capacity constraints at the clinical scales due to very high clinical demand, and the industry has responded in kind with a wave of facility expansions. The type and scale of capacity being installed will also be important as the demand for half of products in mid- to late-stage development can be met with 5,000 L of capacity or less, while the remaining half of products will need larger capacity to meet future demand. However, with the current pandemic, COVID‑19 therapeutics and preventatives will require significant large-scale capacity if approved. With new bioreactor installations reflecting a pre-pandemic demand profile, we are watching how the industry is responding and rising to the challenge to meet the typical and additional demands for capacity, as it is critically important to ensure current and future products are available to patients.
This article has been adapted from the 2020 CPhI Annual Report.
About The Authors:
As the managing director of bioTRAK database services within the BPTG group of BDO, Dawn M. Ecker specializes in the forecasting of the supply and demand of biopharmaceutical products, providing clients with biopharmaceutical market-related analyses. She created BPTG’s proprietary bioTRAK database, developed proprietary forecasting algorithms, and manages the bioTRAK maintenance and operations team. Ecker has enabled biopharmaceutical organizational acquisitions as well as facility expansions, acquisitions, and other investments by providing unbiased data-driven analyses to the industry’s leading contract manufacturers, suppliers, product developers, and investment firms. She can be reached at decker@bdo.com.
Patricia Seymour is a specialist in biopharmaceutical supply chain management, CDMO selection, CMC technical and regulatory strategy, and program management. She is a managing director within the BPTG group of BDO with more than 25 years of experience working with companies to advance biologic products by guiding cGMP drug substance and drug product manufacturing, developing demand and supply models, and managing the labeling, packaging, and distribution of clinical and commercial supply.