
How To Use Quality Metrics To Measure And Improve Training ROI
By Vincent Rubino
Because a training program is a compliance requirement for GMP operations, similar to the compliance requirement to have a QA organization, it is typically considered part of the cost of quality for regulated operations. But, the requirement to have a training program is more than a means to assure compliance; it is an opportunity for companies to increase profits and reduce costs. These avoidable costs are referred to as the cost of poor quality (CoPQ).
A training program cannot replace formal education for basic science and language skills necessary in the GMP workplace. A training program supports, but cannot replace, operation procedures written by experts. As such, primary purposes of training are to provide a positive influence on company culture, maximize performance potential, and ensure workplace integrity. However, even though a training program exists, culture indicators may not be established or measured.
A question many company leaders ask is, “What is the impact of our training program on our bottom line?” This fundamentally important question is challenging to answer. The idea that a GMP training program can increase profits may seem counterintuitive, as the program is usually a cost center and not a source of tuition revenue. But savvy managers identify, understand, and support the drivers of value in business, and they expect a training program to support these value drivers.
Training effectiveness is challenging to measure. Intuition or judgment is commonly applied to examine the problems and opportunities associated with employee learning. This two-part article proposes an approach using data-driven insights from standard quality culture and performance metrics, with CoPQ calculations, to measure training ROI. Calculation of ROI answers the question, “Is this investment worth the expense?” It measures how much money is earned or lost from investment in training and the impact of training on the bottom line.
Part 1 described a framework design for calculating training program ROI using International Society for Pharmaceutical Engineering (ISPE) quality metrics. This installment will explain how to execute such calculations — and how to implement an ROI plan to set and achieve goals that meet specific business objectives.
ROI Values Calculated From Business Results
Actual ROI values must be calculated from actual business results. As such, the metrics and their definitions should be aligned to business results, the definitions must be agreed upon, and these metrics should be consistently collected and reported to support ROI calculation. The metric collection and reporting effort for business results typically requires resources beyond the training department. As many business results are related to quality outcomes, participation of the QA organization is anticipated. The ISPE Quality Metrics Initiative suggests a new quality metrics program start with a small number of clearly defined targets to make the process manageable and more likely to succeed. In this example, two culture indicators were selected (culture survey scores and corrective and preventive action [CAPA] with retraining) which were found to be statistically significant to quality outcomes, as shown by arrows in Figure 1.
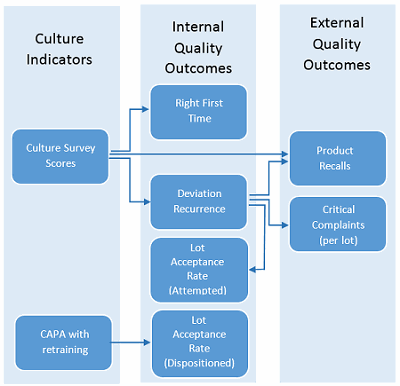
Figure 1: Example metrics for calculating ROI
The actual monetary value of a quality event, such as a deviation, varies depending on the complexity of the problem, organizational efficiency, cost of labor and materials, and its impact to product and services. There is considerable effort required to track and trend these variables, and it is up to each organization to determine the level of investment in assessing the cost of these quality events. Pharmaceutical Manufacturing Research Project (PMRP) CoPQ data could be used as a baseline to provide an estimate where actual calculation is unfeasible (simple failure $10,000 to $100,000, complex failures to $1 million). According to the McKinsey & Company report, Capturing the Value of Good Quality in Medical Devices, companies spend an estimated 0.5 to 0.7 percent of annual sales on deviation investigations, CAPAs, and addressing complaints. In addition, these companies spend about 2.1 percent of annual sales on routine product quality failures.
Following the example metrics in Figure 1, a monetary value can be assigned to the quality metrics to support calculation of the CoPQ trends. The CoPQ values shown in Table 1 are for illustrative purposes only and do not represent the results of any specific organization.
Table 1: Example Metric Definitions and Estimated CoPQ Values
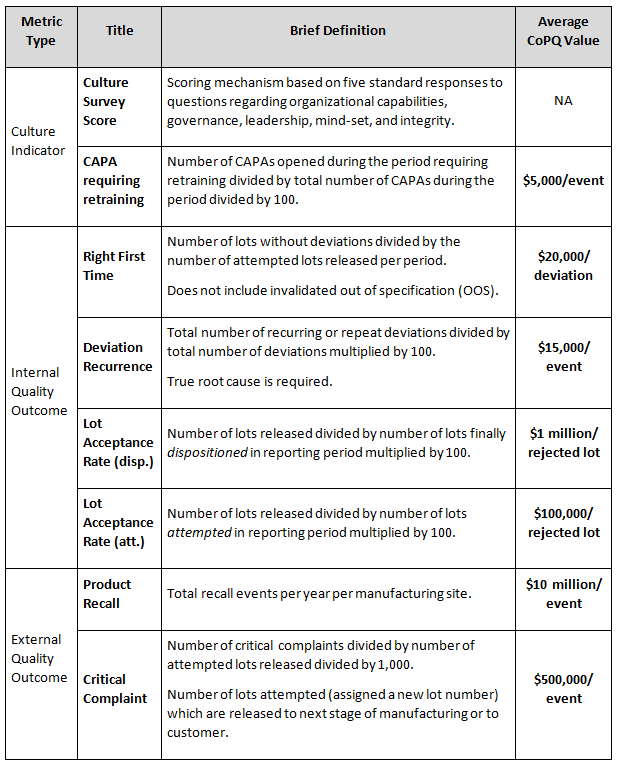
Measured improvements using the example metrics described in Table 1 correspond with reductions in deviations, lot release delays, and other unwanted events. When supported by favorable Kirkpatrick training metric results, any cost savings (recoverable revenue) associated with reduction of CoPQ values are added together to determine the monetary benefit of training. Any losses are subtracted from the cost savings value. In the example results shown in Table 2, the lot acceptance rate (attempted) trend is improving while the lot acceptance rate (dispositioned) is not. Thus, the value of CoPQ savings for attempted lots is added while the value for disposition lots is subtracted. This example illustrates an outcome where lot-rejecting quality problems are identified earlier in the process leading to overall benefit to the bottom line.
Table 1 does not include all possible measured benefits due to a training program. There are many other metrics that could be applied to calculate cost savings, some of which are defined and have been tested in the ISPE Quality Metrics Initiative. They are not included in this example. It is assumed the measured improvements in quality culture will also impact beneficial outcomes that are not measured directly.
Table 2: Example Annual Metric Trend Results and CoPQ Savings
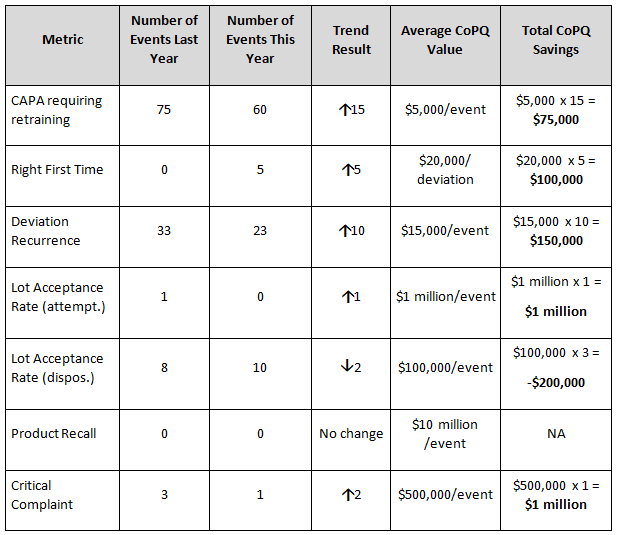
If during a one-year period the metric results occurred as shown in Table 2, and the Kirkpatrick measures also support training improvement outcomes, the benefits of training would be calculated by adding the savings calculated in the right column:
$75,000 + $100,000 + $150,000 + $1 million + (- $100,000) + $1 million = $2.125 million
For an organization with a training program annual budget of $2 million and estimated annual CoPQ savings of $2.125 million, when applied to Equation 1, a training ROI of 6.25 percent is the result.

Training efficiency (cost savings associated with operation of the training program) is an important aspect of fiscal responsibility for a training cost center owner. Reducing the training budget impacts the cost of training and improves ROI, if the benefits of training remain the same. However, training effectiveness produces monetary benefits of greater potential impact to profits than the cost avoidance associated with training efficiency efforts. In addition, the intangible impact of assuring the quality of GMP products and services by avoiding CoPQ is significant to employee and customer satisfaction and company brand.
When the training program is designed to be in alignment with business goals (see Part 1 of this article) and the outcomes measured at each level of the design trend in the same direction, the results confirm the training program impact to ROI.
Establishing The ROI Plan
Performance metrics can help achieve organizational growth and change. The ROI plan illustrates the relationship of business objectives to goals and provides an approach to measure progress. If the plan includes methods to reward achievement and share the results for all to see, it has a better chance of improving quality culture and productivity and moving the organization toward business goals. Performance metrics define and communicate strategic objectives and can be used to identify underperformance and to guide to success. Employees can use performance metrics to focus on what is important. The metrics can be linked to goals defined in employee personal performance plans. When initiating a training effectiveness ROI project, it is recommended the organization start with a few simple metrics selected from the ISPE Quality Metrics Initiative, as illustrated in Figure 1.
Using results of the ISPE Quality Metrics Initiative as a starting point to provide the framework for measuring CoPQ and recoverable revenue returns begins the design process by providing a tested strategy and methodology that is shared by others in the pharmaceutical industry. To ensure success of the project, sponsorship, roles, and responsibilities should be established (Figure 2).
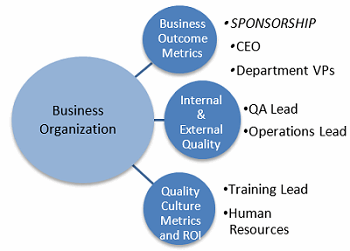
Figure 2: Metrics accountability and reporting
Training Department (TD) Roles And Responsibilities
- Collaborate with business sponsor and QA to verify learning can help achieve plan goals and agree on appropriate programs or initiatives, target audience, approach, and timing of training.
- Support business sponsor’s role as change manager to ensure successful deployment, including plans to reinforce learning.
- Collaborate with business sponsor and QA to determine expected impact and measurements.
- Design, develop, or purchases curricula and instruct, including providing performance support, according to schedule.
- Meet with business sponsor and QA regularly during plan development and implementation to share progress and discuss issues.
- Provide a list of those who did and did not complete the learning by the required dates.
- Collect and report agreed-upon quality culture metrics and ROI. Enlist support of HR for employee retention and other metrics as needed.
- Conduct a review upon completion of the initial phase of the initiative to review results and identify opportunities for improvement and lessons learned.
Business Sponsor Roles And Responsibilities
- Available for discussions to ensure a plan is established to achieve the goals with a clear role for learning.
- Ensure resources are available to work with TD and QA on an appropriate program and target audience.
- Meet with TD and QA to review and approve the recommended program, target audience, and timing.
- Agree with TD and QA on the expected impact of this initiative, metrics, and targets and what is required to achieve these goals.
- Ensure the plan defines:
- business sponsor as the change leader
- steps to kick off this initiative
- how to manage the plan through business sponsor direct reports
- how business sponsor will reinforce the plan and positive and negative consequences to ensure completion and application.
- Ensure subject matter experts (SMEs) who understand the importance of providing the required assistance per the plan schedule are available to TD.
- Ensure business outcome metrics are collected, reported, and shared.
- Meet with TD regularly to review progress, resolve issues, and eliminate roadblocks.
- Meet with TD and QA at initial project completion to review results and identify opportunities for improvement and lessons learned.
QA Roles And Responsibilities
- Collaborate with business sponsor and TD to verify learning can help achieve plan goals and agree on appropriate programs or initiatives, target audience, approach, and timing of training.
- Support business sponsor role as change manager to ensure successful deployment, including plans to reinforce the learning.
- Collaborate with business sponsor and TD to determine expected impact and measurements.
- Collect and report quality culture metrics and internal and external quality metrics.
- Meet with business sponsor and TD regularly during plan development and implementation to share progress and discuss issues.
- Provide periodic quality metrics report at agreed-upon frequency.
Conclusion
A GMP training program is typically focused on compliance with regulatory expectations. While compliance is important, the reason behind the regulatory requirement is where the true value of the training program exists. A high-value GMP training program prevents poor quality in products and services and leads to improved employee and customer satisfaction. A design to align the training program to business values in order to manage outcomes can be challenging. The ISPE Quality Metrics Initiative offers predefined quality and business outcomes, with metrics, which can be used as a design tool to establish a framework for calculating and managing training effectiveness.
The training program efforts should align with the manufacturing/service business goals of increasing business productivity and capabilities, reducing costs, ensuring employees are satisfied and engaged, ensuring opportunities to build the business are achievable, and ensuring customer requirements are met. Establishing the ROI for training effectiveness can demonstrate the actual value of the learning that is delivered.
 About The Author:
Vincent Rubino has worked in regulated healthcare testing and manufacturing since 2000, including roles in engineering, validation, quality, and business development. He began his career with a bioengineering degree from UC Berkeley and now lives and works in South Korea.