
How To Establish Sample Sizes For Process Validation Using The Success-Run Theorem
By Mark Durivage, Quality Systems Compliance LLC
The first article in this series, Risk-Based Approaches To Establishing Sample Sizes For Process Validation (June 2016),  provided and established the relationship between risk and sample size. This installment will demonstrate two methods using the success-run theorem, which uses the confidence level (how sure we are) and reliability value (valid, consistent results) to determine appropriate statistically valid sample sizes for process validation. The first method does not allow or account for failures and is easier to calculate. The second method allows for a predetermined number of failures when measuring, testing, or evaluating the outputs of a validation; however, it is also a bit more complicated to calculate and requires the use of a chi-square distribution degree of freedom (df) calculation and table value look-up.
The chi-square distribution is the distribution of the sum of squared number of standard deviations a score is from the mean of its population. The chi-square distribution is very important because many test statistics are approximately distributed as chi-square.
The df is the number of independent comparisons available to estimate a specific parameter in a statistical calculation representing how many values involved in a calculation have the freedom to vary. The df is calculated to help ensure the statistical validity of chi-square tests.
Start With FMEA
Before we begin, we must establish our definitions of risk and their associated confidence level and reliability value. These definitions can and should vary based upon the organizational needs. A good place to determine the risk level is failure mode and effects analysis (FMEA), a systematic group of activities designed to recognize, document, and evaluate the potential failure of a product or process and its effects. FMEA uses a risk priority number (RPN), which is comprised of frequency, detection, and severity. The higher the RPN, the higher the risk. However, a low probability of occurrence in conjunction with high severity and high probability of detection may still necessitate the appropriate controls for high risk.
Table 1 depicts an example FMEA with the associated risk levels. Once the risk level has been determined (low, medium, high), the appropriate confidence level and reliability can be selected using Table 3. Figure 1 depicts the linkage from FMEA, risk, and confidence level and reliability.
Table 1: Example FMEA
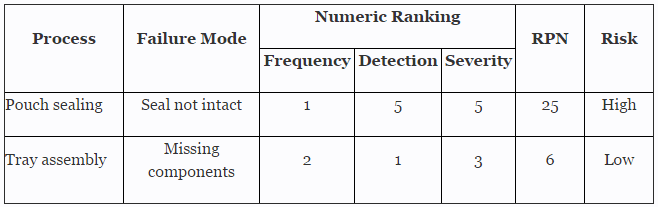
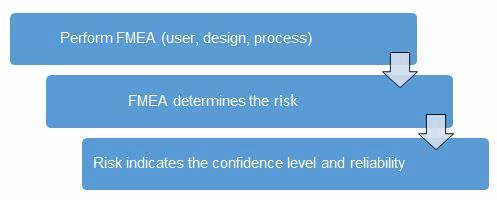
Figure 1: Risk process for determining the appropriate confidence level and reliability
Table 2 shows an example of risk level definitions with accompanying defect classifications. These definitions can and will vary based upon the product(s) produced and its intended and unintended uses.
Table 2: Example of Risk Level Definitions
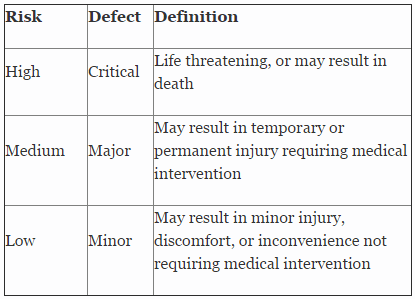
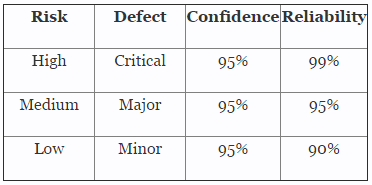
Table 3 depicts example confidence levels and reliability values based upon risk. Of course, different confidence and reliability levels can and should be utilized based upon an organization’s risk acceptance determination threshold, industry practice, guidance documents, and regulatory requirements.
Table 3: Example Confidence and Reliability Levels Based On Risk Acceptance
Success-Run Theorem, Method 1
The first method for using the success-run theorem to determine sample sizes for process validation does not allow for any failures and is somewhat simpler to calculate than Method 2. When calculating the sample size based upon confidence and reliability with zero failures allowed, we can use the following formula:
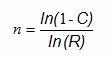
Where:
ln = natural log
n = Sample size
C = Confidence level
R = Reliability
Example: A primary pouch sealing process is deemed to be high risk based on the example FMEA in Table 1. Table 2 defines high risk as a critical defect that can be life threatening or may result in death, which will need to be validated with 95% confidence level and 99% reliability. What is the sample size required to perform a test without failure to be 95% confident the part is 99% reliable? Here is how the formula above would be applied:
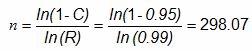 (rounded up to the next integer, 299)
There are a couple of reasons for rounding the answer up to the next whole integer. First is the practical aspect of producing a part of a piece. The second, and most important, reason is that we are claiming (from Table 2) a 95% confidence level and 99% reliability. Therefore, if we were to use 298 parts (rounded down), we could not substantiate the claim of a 95% confidence level and 99% reliability. To be 95% confident the part is 99% reliable, 299 parts must be measured, tested, or evaluated without a failure to ensure the validation meets the risk-based acceptance criteria.
Success-Run Theorem, Method 2
When calculating the sample size based upon confidence level and reliability value with a predetermined number of failures allowed, we can use the following formula:
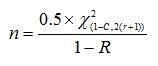
Where:
ln = natural log
n = Sample size
r = Number of failures
C = Confidence level
R = Reliability
 = Chi-square value for a given confidence level for (r) degrees of freedom
(It should be noted that Method 2 can also be utilized when no failures are allowed.)
Example: A tray assembly process is deemed to be low risk based on the example FMEA in Table 1. Table 2 defines low risk as a minor defect that may result in minor injury, discomfort, or inconvenience not requiring medical intervention will need to be validated with a 95% confidence level and 90% reliability. What is the sample size required to ensure we are 95% confident that we are 90% reliable when three failures occur?
To solve this problem, we must first determine the chi-square value using Table 4.
Table 4: Distribution of the Chi-Square (Partial Table)
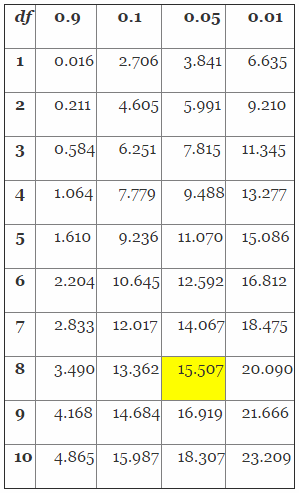
Determining the chi-square value is a three-step process. First, we must determine the proper column value by solving for 1-R, in this case 1-0.95 (confidence level) = 0.05. Second, we must determine the proper row by calculating the appropriate degrees of freedom (df) using 2(r+1), in this case 2(3+1) = 8. Finally, we determine the chi-square value from Table 3 using column 0.05 and df row 8, which yields 15.507. The value (15.507) will then be placed in the equations as shown below to determine the proper sample size.
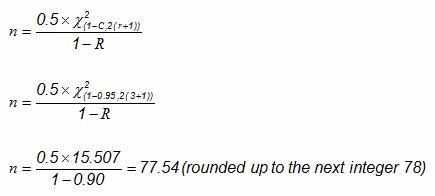
To be 95% confident the process is 90% reliable, 78 parts must be measured, tested, or evaluated with no more than three (3) failures to ensure the validation meets the risk-based acceptance criteria.
Choosing The Right Method For Your Process
In practice, I prefer Method 1 to Method 2. The calculation is easier, and there is no need for a table look up. Additionally, I also feel that failures encountered during process validations are extremely difficult to justify, especially for high- and medium-risk processes. No matter which method is used, the criteria based upon risk should be documented and proceduralized.
I want to reinforce that different confidence levels and reliability values can and should be utilized based upon an organization’s risk acceptance determination threshold, industry practice, guidance documents, and regulatory requirements. Using the success-run theorem to establish sample sizes for process validation activities is a widely used and accepted practice in FDA-regulated industries.
The methods presented here have been used and successfully defended during audits and inspections. I cannot emphasize enough the importance of proceduralizing (documenting) the statistical methods and rationale your organization may use for process validation activities. Table 2 provides an example of documenting and standardizing risk levels, defect classifications, and defect definitions. Table 3 provides an example for documenting the confidence level and reliability requirements for process validation activities. I also recommend that validation and statistical technique procedures include the formulas as well as fully worked examples, like those demonstrated above, to provide clarity and guidance for those individuals writing, performing, executing, and approving process validation activities.
Subsequent articles in this series will provide additional how-to examples for applying risk-based sample size techniques to process validations in your organization.
About the Author
Mark Allen Durivage is the managing principal consultant at Quality Systems Compliance LLC and the author of several quality-related books. He earned a B.A.S. in computer aided machining from Siena Heights University and an M.S. in quality management from Eastern Michigan University. Durivage is an ASQ Fellow and holds several ASQ certifications including CQM/OE, CRE, CQE, CQA, CHA, CBA, CPGP, and CSSBB. He also is a Certified Tissue Bank Specialist (CTBS) and holds a Global Regulatory Affairs Certification (RAC). Durivage resides in Lambertville, MI. Please feel free to email him at mark.durivage@qscompliance.com with any questions or comments, or connect with him on LinkedIn.
References:
- Durivage, M.A., 2014, Practical Engineering, Process, and Reliability Statistics, Milwaukee, ASQ Quality Press
- Durivage, M.A. and Mehta B., 2016, Practical Process Validation, Milwaukee, ASQ Quality Press
- Durivage, M.A., 2016, Risk-Based Approaches To Establishing Sample Sizes For Process Validation, Erie, PA, Life Science Connect