
How To Add Biologics Manufacturing Efficiency With Design Of Experiments, Part 2
By Peter Alexander and Thomas Harrington

This is the second installment in a two-part series on using design of experiments in biologics development and manufacturing.
In part 1 of this article series we described how a statistically-based design of experiments (DoE) strategy can accelerate biopharmaceutical process development and reduce development costs by streamlining process development experiments. DoE strategies can efficiently screen process parameters for their criticality and identify the proven acceptable ranges for those parameters by application of statistical rigor in a reduced set of experiments. As described in part 1, evaluation of four parameters at only two levels would require 24 (2n) or 16 experiments to test each parameter in a pairwise study, while in the application of a statistically-based DoE parameter screening design, eight process parameters can be evaluated at two levels in as few as seven (n-1) experiments.
Here in part 2, we will discuss using DoE methodology to similarly streamline process optimization with two case studies. DoE optimization designs may be used to study three or four parameters at multiple levels to find their optima. As an example, three parameters can be evaluated at five levels in a set of 20 experiments.
Before we explore the case studies, we will briefly discuss the role experiments play in optimizing processes, calculating a budget, and implementing technology to manage experiments.
The Role Of Experiments In Characterization And Validation
Process characterization and process validation are two essential stages in the development of biopharmaceuticals and are required by regulatory authorities to ensure that a manufacturing process is capable of producing the same product having the same quality attributes batch after batch.
These studies involve large numbers of experiments to determine the normal operating range (NOR), proven acceptable range (PAR), and in some cases, the limit of failure (LOF) for each critical process parameter. How critical process parameters (CPPs) in individual unit operations interact to affect the critical quality attributes (CQAs) of the final product becomes important in characterization programs.
Executing A DoE study And Determining Experimental Budget
While the statistical methods described here can be applied manually, the statistical mathematics is complex and numerous software packages are commercially available to simplify the process of experimental design and data analysis. The experimental results are presented graphically as part of the statistical analysis and allow easy interpretation as can be seen in the case studies below.
Preliminary steps for establishing the number of process parameters to assess and the number of experiments to perform involve applying existing process knowledge from the research (product discovery) stage and any available preliminary production data. Most DoE software packages allow the user to select the number of parameters and the number of input levels to assess and use that information to generate a pattern in which the experiments are to be executed. At this stage the software will also provide the resolution, or degree of statistical robustness, for a given number of experiments. Resolution determines the degree to which a given design can establish main effects, along with two-factor and three-factor interactions.
An experimental budget is made from an assessment of the time and resources that are required to execute the necessary experimental design. The cost of execution includes all raw material requirements and laboratory or pilot plant personnel hours, as well as all analytical testing required. Proper batch records are used to protect the integrity and repeatability of the work. The experimental budget also includes a risk-based assessment of the number of experiments required to establish the main effects (CPPs) and their acceptable ranges.
Two case studies are presented here as examples of how DoE methodology can be applied to process characterization.
Case Study 1: Fermentation Process Characterization
This case study describes the application of a four-parameter two-level full factorial (16 batches) with four center points (four batches) as part of a fermentation process characterization program. Process characterization is typically part of a Phase 3 clinical product development program that leads into process validation.
Figure 1 illustrates the upstream portion of a biopharmaceutical production process. Four fermentation parameters (Table 1) were evaluated in this DoE strategy by analyzing data from the subsequent cell harvest, product extraction, and product capture unit operations. In this process, microbial cells were harvested and washed three times to remove residual culture medium. Cell yield after the third wash was used as one of several response parameters taken from subsequent processing steps.
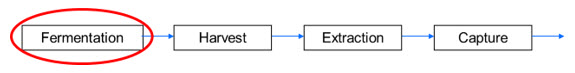
Figure 1. Schematic diagram of a typical upstream process. Four fermentation parameters (Table 1) were evaluated using response parameters from the subsequent cell harvest, product extraction, and product capture steps.
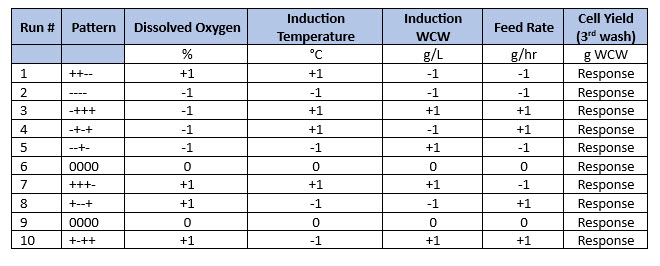
Table 1. Augmented half-factorial design with two center points. In this half-factorial example, four input parameters were evaluated at two levels (-1 and +1) and then center points (level 0) being the normal set points were added to create an augmented half-factorial. Parameters -1 and +1 were the low and high parameter values based on previous screening studies.
The experiments outlined in Table 1 were executed and the wet cell weight after the third cell wash was measured. These data were then entered into the DoE software to assess the half-factorial analysis before completing the full-factorial design in Table 2.
To further define the design space for these four fermentation parameters, a second set of experiments was performed in which the design in Table 1 was “folded over” to create the design shown in Table 2. Using a folded-over design is a way of augmenting a DoE design to increase the statistical power to a higher resolution for identifying interactions. The full-factorial design (Resolution 4) is actually composed of two half-factorial designs (Resolution 3) that are folded over (Table 2).
This allows screening of main effects followed by augmentation if warranted by completing the second half-factorial design. The addition of two center points in each half-factorial design enhances the ability to estimate error. In experiments 11 through 20 (shown in blue), each represents a mirror image of those in experiments one through 10. For example, experiment 11 (- - - +) is the mirror image of experiment seven (+ + + -). This augmented data set of 20 experiments becomes a Resolution 4 design allowing all main effects and interactions to be identified simply by adding 10 runs to the original design.
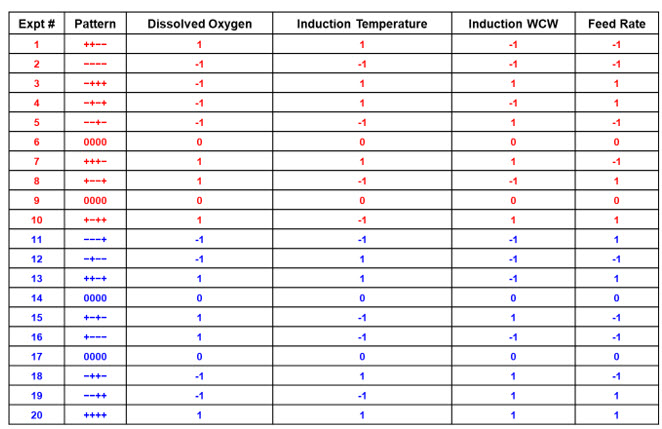
Table 2. Full-factorial design with four center points. Experiments 1 through 10 (red) and 11 through 20 (blue) are each half-factorial designs with two center points [Resolution 3]. Table 1 represents the first 10 experiments (red), which comprise a halffactorial. The complete 20-run set becomes a Resolution 4 design.
The actual by predicted plot for total solids has excellent agreement over a wet cell weight range of 1.5 to 3 kg at harvest (Figure 2) for the 20 batches performed according to Table 2.
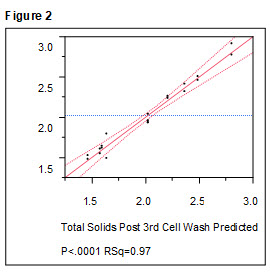
Figure 2. Results of Table 1 experiments on cell yield after third wash. Output data from the experiments performed following the patterns in Table 2 were analyzed using the DoE software. Total solids (wet cell weight) was an output parameter that was found to be significantly affected by the four fermentation parameters tested in the study (p<0.0001, RSq = 0.97).
After completing the statistical analysis of the 20-run study, dissolved oxygen was found not to have an effect on wet cell weight (Table 3). Induction temperature was inversely proportional to washed cell weight (third wash) as indicated by the “-” symbol in Table 3 and was positively correlated “+” with clarified extract volume. Induction wet cell weight was positively correlated with washed cell weight (third wash), and feed rate was positively correlated with both wet cell weight and product yield.
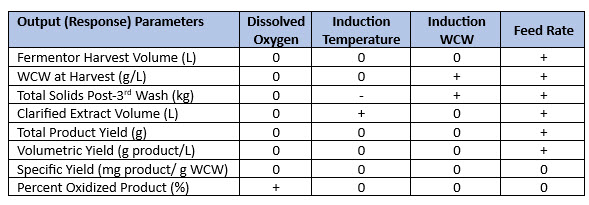
Table 3. Effect of four fermentation parameters on eight upstream output (response) parameters. DoE study data (Table 4) were collected for each of the response parameters shown in the table. “0” represented “no effect,” “-” represented a negative effect, and “+” represented a positive effect.
The interaction profiles (Figure 3) show the degree to which the three critical parameters, induction temperature, induction wet cell weight, and feed rate affected the washed cell weight at harvest.
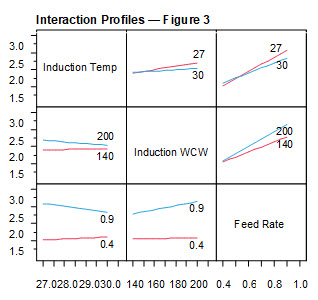
Figure 3. Interaction profiles for fermentation parameters: wet cell weight at harvest. Numerical values in each interaction plot indicate the value of the parameter being tested. Induction temperature was tested at 27°C (red) and 30°C (blue). Induction wet cell weight was tested at 140 g/L (red) and 200 g/L (blue). Feed rate was tested at 0.4 mL/min (red) and 0.9 mL/min (blue). The slope of each plot represents the degree to which that parameter affected wet cell weight after third wash (cell harvest).
Similar interaction plots were created and analyzed for other downstream response parameters (see Table 4 and Figure 4). Table 4 shows that each of the four fermentation parameters tested (Table 2) influenced seven of the nine capture chromatography response parameters. Only load product concentration and step yield were unaffected.
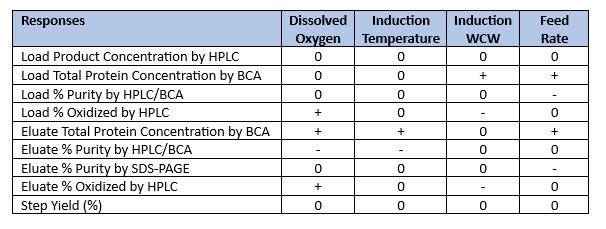
Table 4. Effect of fermentation parameters on product capture chromatography performance. DoE study data for the four fermentation input parameters (Table 4) were collected for each of the capture chromatography response parameters shown in the table. “0” represented “no effect,” “-” represented a negative effect, and “+” represented a positive effect.
The interaction profiles show the magnitude of the effect each of the four parameters had on total protein in the capture column load (Figure 4).
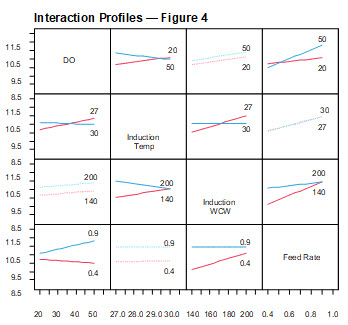
Figure 4. Interaction profiles for fermentation parameters (Table 4): total protein. Numerical values in each interaction plot indicate the value of the parameter being tested. Induction temperature was tested at 27°C (red) and 30°C (blue). Induction wet cell weight was tested at 140 g/L (red) and 200 g/L (blue). Feed rate was tested at 0.4 mL/min (red) and 0.9 mL/min (blue). The slope of each plot represents the degree to which that parameter affected total protein concentration in the capture column load.
Case Study 1 Conclusions
The fermentation DoE ranges for the four parameters under study were determined to be the proven acceptable ranges. Process robustness was established under the following conditions:
- Lower dissolved oxygen and lower induction temperature correlate with higher product purity.
- Higher induction wet cell weight produces lower percent oxidized product.
- Feed rate has significant effects on the fermentation process and productivity; there is a trade-off between product quantity and purity.
- Higher [DTT] extracts more total protein but not more product.
Case Study 2: 12-Parameter Plackett-Burman Folded-Over Screening Design
A 12-Parameter Plackett-Burman Folded-Over Screening Design was used to identify all main effects and potential interactions among these parameters on four purification response parameters. This produced a Resolution 4 for the folded-over design in 24 batches with each parameter tested at two levels (Table 5). There were no center points in this design. In the original project scope, approximately 40% of the project experimental budget was allocated to performing this screening design with all required analytical testing.
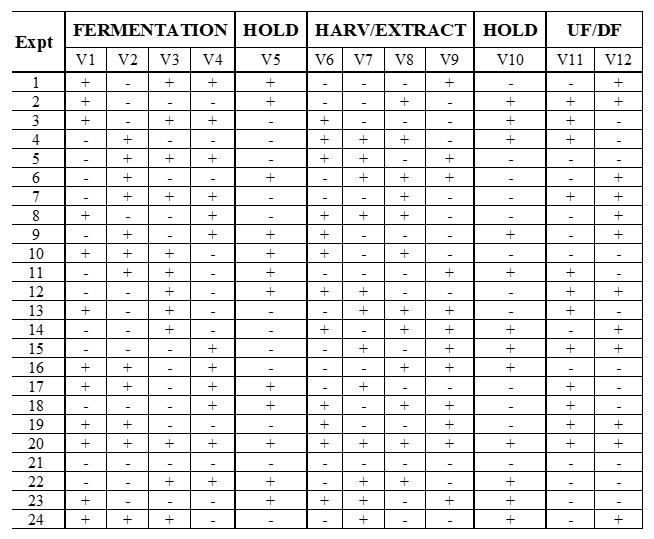
Table 5. 12-Parameter Plackett-Burman Folded-Over Screening Design. Twelve upstream parameters were tested for their effects on four purification response parameters: product purity, product concentration, process yield, and step yield.
The 12 different parameters were assessed for impacts on product purity, product concentration, process yields, and step yields. Four batches were terminated after extraction because they failed percent purity pooling criteria, creating a challenge for statistical analysis. Process yield results might be biased because the analysis is compromised by the loss of balance and orthogonality. We need to understand why four batches of 24 failed to complete.
Only one of the 12 fermentation variables, (Var3, Induction wet cell weight), had a significant effect on process yield (p<0.0153) while three others showed trends toward having an effect (Figure 5). None of the other variables affected process yield.
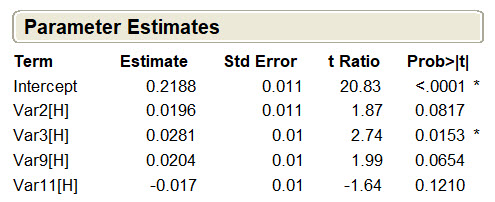
Figure 5. Parameter estimates for process yield. Process yield data were entered into the DoE software and used to calculate the probability that each upstream variable had a statistically significant (p<0.05) effect on process yield. The other eight upstream parameters were insignificant and not shown.
This same analysis was performed for the remaining three response variables and three additional CPPs were identified, including the induction temperature (V2, p<0.001), room temp hold (V5, p<0.0016), and the interaction of V2 and V5 (p<0.0169). The interaction of low induction wet cell weight and high room temp hold contributed to the four failed batches; this two-parameter interaction was studied further in a full-factorial design with replication of each point.
A response surface design was then used to optimize four CPPs - two from fermentation, the room temp hold, and one extraction parameter.
Case Study 2 Conclusions
A 24-batch Folded Over Plackett-Burman Screening Design identified four CPPs (p<0.05) among 12 parameters tested and comprised approximately 40% of the allocated experimental budget. Performing this same study as a series of one-off experiments would have required 212, or 4,096, separate experiments.
Executing this screening design streamlined the process of identifying the four CPPs, one of which was an interaction between two CPPs. This allowed a 20% portion of the experimental budget to be applied to investigating the interaction. The remaining 40% of the budget was then applied to the final process characterization.
In total, 68 experiments were required to fully characterize 12 potential CPPs and identify the four actual CPPs. This was made possible by the application of a DoE strategy and a well-planned experimental budget.
About the Authors:
 Peter Alexander has over 35 years of industrial biotechnology experience in process development for therapeutic and vaccine products in numerous technology platforms, including conjugate polysaccharides, recombinant proteins, DNA vaccines, adenovectors, and virus-like particles. He is an independent consultant with a focus on CMC, technology transfer, and scale-up. He has held management and senior director positions for Aeras, IDT Biologika Corp., Lonza, Cambrex, and Baxter among other companies.
 Thomas Harrington is an independent consultant with over 20 years of experience in biopharmaceutical and pharmaceutical process development and manufacturing. Throughout his career, he has led process and operational strategy initiatives for Abbott Laboratories, Altus Pharmaceuticals, Lonza Biologics, and Genzyme Corp., which is now Sanofi’s specialty therapeutics division. He has expertise in process validation of biopharmaceutical manufacturing processes. He has extensive practice in using design of experiments to perform process characterization studies to determine critical process parameters for upstream and downstream unit operations.