
DEA Reveals Hidden Costs Of Analytical Validation Guidelines
By Bilel Khedir, Qualified Person, Galien Pharmaceuticals

Analytical method validation is a cornerstone of pharmaceutical quality assurance, ensuring that analytical procedures are fit for their intended purpose. Fundamentally, statistics is a universal language; therefore, one would expect the mathematical proof of a method's validity to be inherently harmonized regardless of regulatory jurisdictions. Yet while the ultimate objective, proving scientific validity for compliance, is universal, the statistical pathways and empirical models dictated by various global guidelines diverge significantly. Consequently, the operational burden placed on analytical laboratories varies drastically depending on the chosen regulatory framework.
Historically, literature comparing analytical validation guidelines has focused almost exclusively on statistical rigor and scientific robustness. The trade-off between statistical rigor and efficiency, while universally experienced on the laboratory floor, is rarely quantified in methodological comparisons. Debates frequently center on the merits of classical sequential hypothesis testing versus modern streamlined approaches relying on definitive decisional criteria. For instance, simply switching from the classical SFSTP 1992 framework to ICH Q2(R2) can reduce baseline HPLC occupancy time by up to 33.3%. This dramatic difference in equipment utilization underscores the need for a standardized method to evaluate these frameworks beyond just their mathematical purity.
To bridge the gap between statistical theory and laboratory management, operations research methodologies, specifically data envelopment analysis (DEA), can be applied to regulatory frameworks. By treating distinct validation guidelines as decision-making units (DMUs), DEA allows for the mathematical evaluation of their resource efficiency.
This article builds upon previous operational modeling to present a refined, corrected DEA framework.1 Initial models inadvertently rewarded heavy preliminary testing by treating all statistical evaluations equally; this refined approach introduces a mathematical penalty for redundant hypothesis testing. By comparing the initial and current models, this study aims to reveal the true operational drag of historically entrenched guidelines, providing quality assurance and R&D managers with a quantitative tool to optimize analytical resource allocation.
Methodological Evolution
The application of DEA to evaluate regulatory guidelines requires precise definition of the input parameters. If the mathematical inputs do not accurately reflect physical laboratory realities, the resulting efficiency frontier will be distorted. In early iterations of operational modeling for analytical validation, the framework struggled to properly categorize the burden of statistical analysis, leading to a mathematical paradox.
The Baseline Model and the Mathematical Paradox
In the initial DEA model,1 the efficiency of a regulatory guideline was evaluated by treating all statistical evaluations as equal contributors to the validation process. The input parameter was defined as the number of manual preparations divided by the total sum of all statistical tests (both preliminary and decisional), expressed as:

This architecture inadvertently created a mathematical loophole. By positioning the total count of statistical tests as a denominator, the model implied that a higher number of statistical evaluations reduced the input burden, thereby artificially increasing the guideline's efficiency score. Consequently, classical frameworks that mandate heavy sequential hypothesis testing, such as verifying normality and homoscedasticity prior to evaluating decisional criteria, were falsely rewarded. This model masked the true operational reality: excessive preliminary tests do not reduce the laboratory workload; they inflate it by consuming additional analyst time, software processing, and review cycles.
The Refined "Friction Multiplier" Architecture
To correct this anomaly, the DEA model must structurally differentiate between decisional and preliminary statistical tests. It is important to note that within this operational framework, the term "statistical test" is applied broadly to encompass both simple mathematical acceptance criteria (e.g., verifying if a relative standard deviation is less than 1%) and complex inferential statistical models (e.g., Cochran's test for variance homogeneity).
Decisional tests directly yield the final regulatory validation outcome (the ultimate pass/fail criteria). Conversely, preliminary tests merely validate the statistical assumptions required before performing the subsequent decisional evaluations.
Preliminary testing acts as operational friction. It does not directly contribute to the final regulatory output but serves as an administrative and analytical hurdle.
Therefore, the corrected algorithm introduces a multiplier effect, expressing the refined input as:

In this refined formula, the ratio of total tests to decisional tests acts as a penalty multiplier. If a guideline requires zero preliminary tests, the multiplier simplifies to 1, meaning the input remains exactly equal to the number of manual preparations. However, if a framework demands extensive preliminary hypothesis testing, the multiplier increases, mathematically scaling up the "manual preparations" to reflect the hidden operational drag. By implementing this correction, the DEA model ceases to reward over-engineered statistical frameworks and strictly evaluates the true resource expenditure required to achieve regulatory compliance.
Materials And Methods
Decision-Making Units (DMUs)
In DEA, the entities being evaluated are defined as DMUs. To evaluate the operational efficiency of global analytical validation standards, six distinct regulatory guidelines were selected as DMUs to represent a cross-section of compendial and agency-specific frameworks:
- ICH Q2(R2): The International Council for Harmonisation guideline.
- USP: The United States Pharmacopeia standard.
- ChP: The Chinese Pharmacopoeia standard.
- SFSTP 1992: The classical framework published by the Société Française des Sciences et Techniques Pharmaceutiques.
- ANVISA (2017): The Brazilian Health Regulatory Agency standard (RDC 166/2017).
- JFDA (2021): The Jordan Food and Drug Administration guideline.
Data Collection and Variable Definition
The foundation of the DEA model relies on categorizing the laboratory workload mandated by each guideline. The data set was constructed by quantifying three critical variables for each DMU:
- Manual Preparations: The total count of solutions directly used in the validation process that are prepared manually by the analyst (e.g., specific concentration levels, required replicates). This metric isolates the physical labor and time expenditure required before any instrumental analysis begins.
- Preliminary Statistical Tests: The count of hypothesis tests utilized solely to verify statistical assumptions (e.g., tests for normality and homoscedasticity) prior to final evaluation.
- Decisional Statistical Tests: The count of final mathematical criteria (e.g., recovery percentages, precision relative standard deviation) that directly determine regulatory compliance.
The complete data set utilized for this study is detailed in Table 1. A granular breakdown of the specific manual preparations and statistical tests categorized for each guideline validation parameter is available in the supplementary material.
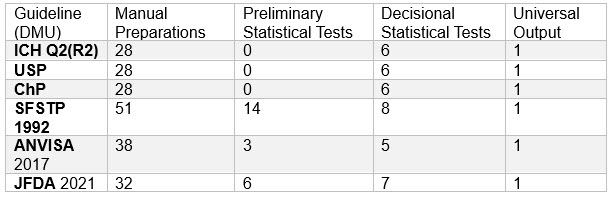
Table 1: Raw Operational Dataset by Regulatory Guideline.2,3,4,5,6,7,8 Note: The output is universally fixed at 1 across all DMUs, representing successful regulatory compliance.
Mathematical Modeling and Input Formulation
To demonstrate the methodological evolution and correct previous modeling limitations, the raw data from Table 1 must be processed through two distinct mathematical strategies to generate the DEA inputs.
- Strategy A (The Baseline Model): In the initial modeling attempt, all statistical tests were treated as equal contributors to the validation process. The input parameter is calculated by dividing the manual preparations by the total sum of all statistical tests:

- Strategy B (The Refined Model): To correct the mathematical paradox that rewarded redundant hypothesis testing, the refined model introduces a friction multiplier. Preliminary tests are structurally penalized as an operational drag, formulated as:

DEA Execution
To calculate the relative efficiency of these frameworks using the generated inputs, an input-oriented constant returns to scale (CRS) model, also known as the Charnes, Cooper, and Rhodes (CCR) model, was applied.9
An input orientation was selected because the operational output (y = 1) is a fixed regulatory absolute that cannot be maximized. Therefore, operational efficiency can only be achieved by minimizing the input parameter.
The efficiency score θ for any given DMU evaluates how far the inputs can be proportionally reduced while still achieving the fixed output.
A DMU achieving an efficiency score of θ = 1.000 establishes the optimal operational frontier. DMUs with scores of θ < 1.000 are inefficient, highlighting a disproportionate drain on laboratory resources relative to the regulatory output achieved.
Results
Calculated Inputs Per Strategy
Applying the formulas defined in the methodology to the raw data set yields significantly different operational inputs depending on the strategy utilized. Under Strategy A (the baseline model), heavy preliminary testing mathematically dilutes the input burden. Under Strategy B (the refined model), preliminary testing acts as a mathematical penalty, amplifying the base manual preparations. The calculated inputs for all DMUs are presented in Table 2.
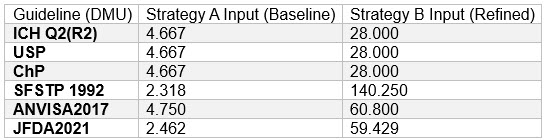
Table 2: Calculated DMU Inputs Per Strategy
Comparative DEA Scores and Efficiency Frontiers
Utilizing the inputs from Table 2, efficiency scores θ were calculated under the input-oriented CRS architecture using MaxDEA X software. A score of θ = 1.000 establishes the optimal operational frontier. The comparative scores, resulting guideline rankings, and the dramatic rank shifts between the two strategies are detailed in Table 3.
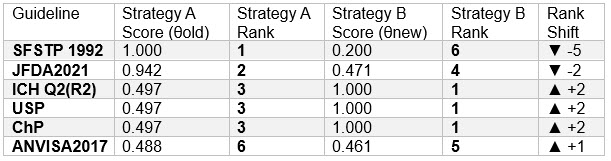
Table 3: Comparative DEA Efficiency Scores and Guideline Rankings
The Mathematical Paradox Unveiled (Strategy A Analysis)
Executing the baseline model vividly exposes the mathematical paradox discussed in the methodology. Under this flawed architecture, SFSTP 1992 dictates the optimal efficiency frontier with a perfect score of 1.000. Because the baseline model divides the 51 manual preparations by the massive sum of all statistical tests (22 in total), the input is artificially diluted to an exceptionally low score of 2.318.
Consequently, highly streamlined guidelines like ICH Q2(R2), USP, and ChP, which require only six decisional tests and zero preliminary tests are severely penalized, appearing highly inefficient with a score of 0.497. This mathematical output directly contradicts physical laboratory realities, falsely suggesting that conducting 14 additional preliminary hypothesis tests saves analytical resources.
The Corrected Operational Reality (Strategy B Analysis)
Applying the friction multiplier in the refined model entirely inverts the efficiency frontier, aligning the mathematics with laboratory reality. By structurally penalizing preliminary tests, the true operational burden is revealed:
- The Optimal Frontier: ICH Q2(R2), USP, and ChP shift to establish the true efficiency frontier (θ = 1.000, Rank 1). Requiring zero preliminary tests, their friction multiplier is exactly 1, meaning their operational drag is purely defined by the 28 manual preparations required.
- The Inefficient Outlier: Stripped of the mathematical loophole that previously diluted its inputs, SFSTP 1992 collapses from the most efficient framework to the most operationally restrictive (θ = 0.200, Rank 6). The 14 preliminary tests act as a heavy operational penalty, driving the functional input burden up to 140.250.
- The Middle Ground: ANVISA and JFDA settle into the middle of the distribution (θ = 0.461 and θ = 0.471, respectively). These frameworks attempt to bridge the gap between simple compendial mandates and heavy statistical modeling but still carry the operational drag of moderate preliminary testing requirements.
Discussion
Deconstructing the Efficiency Frontier
The refined DEA model accurately aligns mathematical efficiency with modern industrial laboratory management. The frameworks establishing the optimal frontier (ICH Q2(R2), USP, and ChP, all scoring θ = 1.000) demonstrate that regulatory compliance can be achieved without the operational drag of preliminary hypothesis testing. By relying strictly on definitive decisional statistical criteria — such as the direct evaluation of precision through RSD and accuracy through recovery percentages — these guidelines minimize manual preparations and eliminate redundant statistical friction.
The Tangible Cost of the SFSTP 1992 Bottleneck
The collapse of the SFSTP 1992 guideline to an efficiency score of 0.200 under the corrected model is not merely a mathematical artifact; it reflects a severe physical and financial burden on laboratory operations. In the context of an input-oriented DEA framework, an efficiency score of 0.200 signifies that the most streamlined units on the optimal frontier achieve the exact same regulatory output utilizing only 20% of the operational resources demanded by SFSTP 1992. Conversely, this demonstrates that laboratories adhering to the SFSTP protocol are mathematically expending five times the necessary analytical friction to reach the same scientific conclusion.
A direct operational comparison between the SFSTP framework and the ICH Q2(R2) frontier reveals the tangible costs of this inefficiency:
- Equipment Bottlenecking: Executing the same method validation under the SFSTP protocol could cause a 25% larger equipment burden. This expands the baseline HPLC chain occupation time by 30%.
- Labor and Time Delay: From an organizational standpoint, SFSTP requires three full days of validation per analytical method (assay, dissolution, and related substances), whereas ICH requires only two days, representing a massive 33.3% loss in productivity.
- Solvent and Reagent Waste: The excessive injections directly drive up the consumption of costly and hazardous reagents. Validating a method under SFSTP could increase hazardous consumption up to 25%.
Regional Implications and Global Harmonization
For pharmaceutical laboratories operating in Francophone and North African regulatory environments where the SFSTP 1992 framework remains historically entrenched, this operational inefficiency acts as a severe competitive disadvantage. Adhering to sequential hypothesis testing directly inflates R&D costs, accelerates equipment depreciation, and delays critical time-to-market milestones for new drug product dossiers.
The urgency of aligning statistical robustness with operational efficiency is highly relevant in current global regulatory shifts. For example, the Brazilian Health Regulatory Agency (ANVISA), whose current framework (RDC 166/2017) operates at a moderate efficiency score of 0.461, is negotiating a transition to ICH standards by the end of 2026. The findings of this refined DEA model provide a solid quantitative rationale behind such harmonization efforts: transitioning to the ICH approach is not merely an administrative alignment but a fundamental operational imperative that eliminates analytical friction and maximizes laboratory throughput.
Conclusion
Analytical method validation must guarantee scientific robustness, but it cannot ignore industrial efficiency. Previous attempts to model this dynamic using DEA inadvertently masked the operational drag of classical statistical frameworks. By introducing a corrected algorithm that mathematically penalizes preliminary hypothesis testing as a friction multiplier, this study establishes a true efficiency frontier. The results demonstrate that highly sequential frameworks, such as SFSTP 1992, impose severe quantifiable burdens on laboratory capacity, equipment utilization, and reagent consumption. As global regulatory bodies like ANVISA move toward ICH harmonization, pharmaceutical operations and R&D management must proactively adopt these streamlined standards to remain competitive, ensuring absolute regulatory compliance while optimizing essential analytical resources.
References:
- Khedir, B. (2026). A comparison of analytical validation guidelines using data envelopment analysis. Pharmaceutical Online. pharmaceuticalonline.com
- ICH Q2(R2): Validation of Analytical Procedures. Step 4, November 2022. ich.org
- U.S. Pharmacopeia ⟨1225⟩ Validation of Compendial Procedures. Pharmacopeial Forum 51(6), 2025.
- Chinese Pharmacopeia Commission. Guideline 9101. Chinese Pharmacopoeia 2020 Edition. Beijing: NMPA; 2020.
- Commission SFSTP. Guide de validation analytique. STP Pharma Pratiques. 1992;2(4):205–239.
- Brazilian Health Regulatory Agency (ANVISA). (2017). Resolução RDC nº 166, de 24 de julho de 2017 [Collegiate Board Resolution No. 166 of July 24, 2017]. Brasília: ANVISA.
- Jordan Food and Drug Administration. JFDA Guidelines for Validation of Analytical Procedures. Rev 00 – August 2021. [Note: latest version should be verified with JFDA directly.]
- Elumalai, S., Dantinapalli, V. L. S., & Palanisamy, M. (2024). Comparative Analysis of Analytical Method Validation Requirements Across ICH, USP, ChP and ANVISA: A Review. Journal of Pharmaceutical Research International, 36(12), 54–71
- Charnes, A., Cooper, W. W., & Rhodes, E. (1978). Measuring the efficiency of decision making units. European Journal of Operational Research, 2(6), 429–444.
About The Author:
 Bilel Khedir is a Qualified Person at Galien Pharmaceuticals, where he leads GMP compliance, regulatory affairs, and pharmaceutical development for oral solid dosage forms and dietary supplements. He holds a Doctor of Pharmacy (PharmD), an MSc in drug development from the Faculty of Pharmacy Monastir, and an MSc in business analytics from Tunis Business School. His expertise spans regulatory strategy and MA submissions, industrial scale-up and tech transfer, analytical method validation (ICH Q2), cleaning validation, and GMP oversight in compliance with ANMPS (Agence Nationale des Medicaments Tunisia) requirements. He is a member of ISPE and a 2024 ISPE Professional Development Grant recipient. His previous roles include pharmaceutical development project manager and quality assurance pharmacist at Opalia Recordati, and validation specialist at Teriak. He can be reached at bilelbilelkhedir@gmail.com.