
Cleaning Process Development: Time To Clean Studies & The Cleaning Assurance Level For Pharmaceutical Products
By Ruijin Song and Andrew Walsh, Center for Pharmaceutical Cleaning Innovation (CPCI)
Part of the Cleaning Validation for the 21st Century series
Part 1 and Part 2 of this series on Cleaning Process Development discussed how quick and economical laboratory-scale studies can be used to determine the "hardest-to-clean" products or compounds1 and how they can be used for selection of cleaning agents.2 In Part 1 we also proposed that laboratory-scale studies can provide answers to typical cleaning validation questions such as:
- Which product is the hardest to clean?
- Which cleaning agent provides the best cleaning?
- Can we demonstrate that two cleaning agents are equivalent?
- How long does it take to clean the equipment?
- Which cleaning input parameters are critical?
- What are the optimal cleaning parameter settings?
- Are dirty hold time studies necessary at commercial scale?
Part 3 will discuss how bench-scale studies can be used for determining the approximate "time to clean" for a product to guide the selection of starting time for cleaning qualification studies and provide an answer to Question 4.
With the many mergers in recent years, a lot of companies have tried to consolidate their manufacturing to a smaller number of plants and increase their production capacity but have been finding that cleaning procedures significantly impact their ability to do so. Quite often, 50 percent or more of manufacturing time has been found to be spent on cleaning and manufacturing capacity cannot be increased. Likewise, the cleaning cycles, particularly clean-in-place (CIP) systems, were never optimized and were simply designed with excessive wash and rinse time periods to ensure cleaning. Companies have also found that CIP systems lack consistency in their design and implementation. Many multinational companies now have global CIP projects to study and fix these problems.
Question 4: How Long Does It Take To Clean The Equipment?
A simple time to clean study can provide a rapid and efficient way to evaluate the behavior of a product during cleaning and obtain a reasonable estimate of the actual amount of time needed to achieve acceptable cleaning. The CIP model system with a rotating spray ball, designed at the Center for Pharmaceutical Cleaning Innovation (CPCI) and shown in Figures 1 and 2, can be used to model CIP operations and quickly gather data that can be used to estimate cleaning time.

Figure 1: Model manufacturing vessel with CIP system
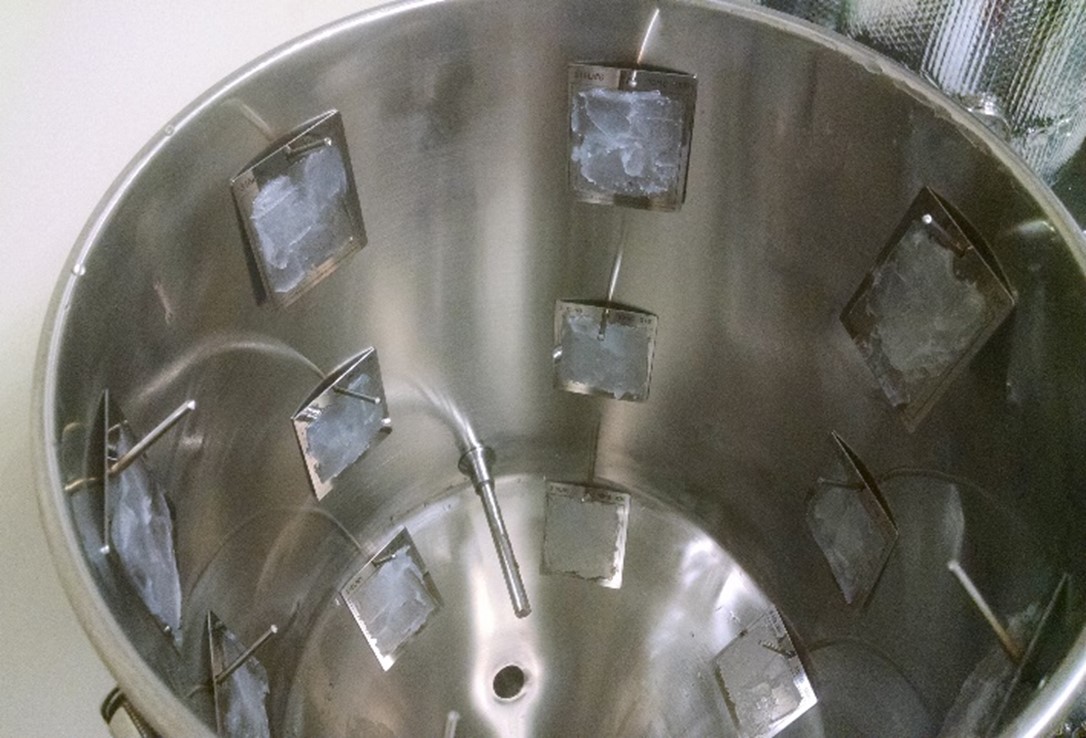
Figure 2: Interior of manufacturing vessel showing spiked coupons suspended on stainless steel rods
For example, CPCI performed a study on a difficult to clean process residue (egg whites) at a low temperature (40°C) using only tap water (no additional cleaning agent) to ensure that measurable data could be collected. The egg whites were spiked onto coupons, dried overnight, and then cleaned in the model CIP system. The residue level (µcg/cm2) after cleaning was monitored at 10-second intervals from 0 to 120 seconds. The residue data collected were plotted using Minitab and a cleaning curve was created for the egg whites (Figure 3).

Figure 3: Fitted line plot of residue — linear model
Figure 3 shows the fitted plot of the residue data evaluated against a linear model. While the R-Sq (adj) of 89.9 percent indicated a reasonable fit, visual examination of the data revealed possible curvature, which is expected with a cleaning process. Since there probably was curvature, this means that any extrapolations using the regression equation based on a linear model could possibly under- or overestimate the time to clean, leading either to cleaning failures or to excessive cleaning times if attempted during commercial-scale qualification runs. These egg white residue data were again plotted but evaluated against a quadratic model (Figure 4).

Figure 4: Fitted line plot of residue — quadratic model
The R-Sq (adj) of 97.4 percent and visual examination both revealed a better fit for the data. While the quadratic model is a better fit and demonstrates that there is curvature in the data, it is not an appropriate model for extrapolating estimated cleaning times. So, to correct for the curvature, these egg white residue data were transformed using a square root transformation and again plotted and evaluated against a linear model (Figure 5).
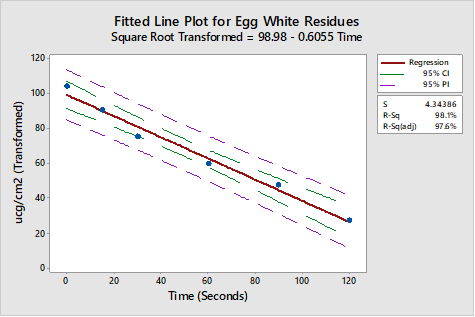
Figure 5: Square root transformation for egg white residue data
The R-Sq (adjusted) of 97.6 percent and visual examination of the regression plot both revealed a better fit for the data. As these data are now linear, extrapolation may be used with some degree of confidence. The regression equation derived from this evaluation can be used to extrapolate a time to clean value as follows. The square root transformed model has a regression equation of:
Square Root Transformed = 98.98 - 0.6055 x Time
This square root transformed regression equation can be rewritten as:
Time = Square Root Transformed - 98.98) / 0.6055
The importance of this square root transformed regression equation is that if we substitute a "target residue" (for example in µg/cm2) into the equation for the Square Root Transformed term we can then easily calculate how long it will take to get to that target residue level. The result just needs to be squared to return to the appropriate value. Since cleaning limits based on health-based exposure limits (HBELs) typically have high residue levels, it would be more appropriate to target a residue level that would be "visually clean." Several studies have put the detection limits of visual inspection at somewhere around 1 to 10 µg/cm2, so 1 µg/cm2 would make a good target residue.
In the case of these difficult to clean egg whites, such an analysis results in a time of about 7 hours to achieve a residue level of 1 µg/cm2. Of course, this is cleaning with tap water at 40°C. Higher temperatures, and possibly the use of a cleaning agent, would alter this regression analysis to yield a much better time. Experiments could be run over a range of temperatures and cleaning agent concentrations using the one factor at a time (OFAT) technique to find the optimal settings to achieve the shortest time to clean. The OFAT is an outdated approach that is inefficient and often misses the optimal settings. So, OFAT is not recommended, and how to select the appropriate parameter settings will be discussed in the next chapter on design of experiments.
Residue data can also be analyzed to determine the best-fitting regression equation. Figure 6 shows an analysis from an actual product study that resulted in a regression equation of ucg/cm^2 = 2272.27 * 0.97049 ^Time(s).

Figure 6: Nonlinear regression analysis
After identifying the best-fitting regression equation, the same rearrangement of terms can be performed and a target residue of 1 µg/cm2 can be substituted into the equation to calculate the time to clean.
A convenient and free tool that can be used to calculate and plot the results of this transformation is the computational knowledge engine found on the WolframAlpha website (www.wolframalpha.com). An example output of this tool is shown in Figure 7.

Figure 7: Wolfram Alpha time analysis for residue target of 0.1 µg/cm2
Another tool that can be used is trend analysis, where time series data can be fit to a general trend model, allowing a "forecast" to be made from the data. There are several models available, and an exponential growth/decay model has been found to be useful (Figure 8).

Figure 8: Trend analysis for ucg/cm^2 using the growth curve model
Figure 8 shows a forecast made using a nonlinear regression equation with an endpoint shown at the target residue level of 1 µg/cm2 with a reference line added to the plot to show where the cleaning would have passed the HBEL.
Multiple analyses can also be plotted to show the differences in cleaning times between different products/compounds. Figure 9 shows results for two actual products with different times to clean. The company can decide to clean for at least 20 minutes in all cases or opt to have product-specific cleaning times based on these analyses. This could require significantly more validation runs, but if the gains in production time were significant, this may be an option to consider.

Figure 9: Comparison of two products and their projected times to clean
It is recommended to run all the methods for comparison to better inform the decision process. Studies at CPCI have found that these different approaches tend to confirm each other, which provides more confidence in the selection of starting times for qualification runs.
Summary
Time to clean studies combined with statistical analyses can be powerful tools to determine a target time for completion of cleaning before starting commercial-scale validation studies. These studies can also be used for demonstrating a cleaning assurance level (CAL) for a cleaning process for those companies that cannot easily demonstrate successful cleaning using analytical methods. As discussed in a previous article in this Cleaning Validation for the 21st Century series, an approach can be taken similar to the sterility assurance level (SAL) approach that is used in aseptic processing.3
As discussed in that article, the general definition of an SAL for a sterilization process is 10-6, reflecting the probability of a single unit out of 1 million being non-sterile after it has been subjected to the sterilization process. For cleaning processes, a general definition for CAL could be 10-6, reflecting the probability of one single cm2 out of 1 million being ≥ the MSSR (maximum safe surface residue) after it has been subjected to the cleaning process. The CAL could also be extrapolated to a probability of not more than one dosage unit exceeding the HBEL (as applied to single unit) out of 1 million units processed on shared equipment surface. There is already a similar existing idea for such a CAL in the medical device industry.4
Experimental studies in the CPCI laboratory have typically found a first-order relationship between residue levels and time during a cleaning process as shown in Figure 10.

Figure 10: Hypothetical model of cleaning assurance level determination (Note: This graph is not based on real data and is strictly for illustration purposes only. The behavior of each product during cleaning must be determined individually as all products have unique behaviors.)
Figure 10 shows a graph of a hypothetical cleaning process that exhibits a log10 reduction in residue level over time (minutes). What we see in this graph is a hypothetical cleaning process that starts at time zero with 10,000 µg/cm2 of residue and after 4 minutes achieves a hypothetical MSSR level of 1 µg/cm2. We further see that after another 4 minutes the cleaning process has achieved a 4-log reduction below the MSSR. This is what we normally look for in sterilization processes. Similarly, the residue data collected in time to clean studies can be easily converted into such a plot and a CAL value calculated. Once a required log reduction has been decided upon, a cleaning process can be considered finished when it achieves that log reduction. For example, in Figure 10, if a 3-log reduction from the MSSR is required, then the cleaning process could be stopped at 7 minutes.
Ultimately, though, for the most ideal results, such time to clean studies must be performed at the optimal parameter settings. Part 4 of this series will explore the use of design of experiments to identify which cleaning input parameters are critical and how to determine the optimal settings for these critical cleaning parameters.
Peer Review:
The authors wish to thank Sarra Boujelben, Gabriela Cruz, Ph.D., Mallory DeGennaro, Ioana Gheorghiev, M.D., Miquel Romero Obon, Prakash Patel, Siegfried Schmitt, Ph.D., and Joel Young for providing many insightful comments and helpful suggestions.
References:
- Song, Ruijin, Alfredo Canhoto, Ph.D., and Andrew Walsh, "Cleaning Process Development: Cleanability Testing and "Hardest-To-Clean" Pharmaceutical Products" Pharmaceutical Online January 2019.
- Song, Ruijin and Andrew Walsh, "Cleaning Process Development: Selection of Cleaning Agents," Pharmaceutical Online November 2020
- Walsh, Andrew, "Can Alternative Approaches to the permitted/acceptable daily exposure be justified?" BioPharm lnternational eBook October 2015
- https://www.researchgate.net/publication/282252219_Cleaning_Validation_of_medical_products
About The Authors:
 Ruijin Song is a senior validation specialist at the Center for Pharmaceutical Cleaning Innovation (CPCI) where she has been engaged in research on cleanability studies, including determination of hardest to clean products, cleaning agent selection studies, time to clean studies, and the design of experiments to optimize cleaning processes for internal research and CPCI clients. She also has extensive experience in TOC and UV method development and validation, swab recovery studies, and the qualification of visual inspection. Song has an MS in chemical engineering from Columbia University and an MS in material science from Tongji University. She can be contacted at ruijin.song@clean6sigma.com.
 Andrew Walsh is president of the Center for Pharmaceutical Cleaning Innovation (CPCI), a not-for-profit research and educational organization focused on cleaning validation. He is very active in developing industry consensus standards with the American Society for Standard and Materials International (ASTM) and has led the teams writing the E3106 Standard Guide for Cleaning, the E3219 Standard Guide for HBELs, the G121 Standard Practice for Preparation of Coupons, the G122 Standard Method for Evaluating Cleaning Agents and Processes, and the E3263 Standard Practice for Qualification of Visual Inspection. He is also involved with updating the PDA Technical Report #29 on cleaning validation. Walsh, who is writing a textbook on Science, Risk and Statistics-based Cleaning Process Development and Validation, also teaches a graduate-level course in Cleaning Validation in the Temple University School of Pharmacy Regulatory Affairs and Quality Assurance Program. Walsh has an M.S. in biology (microbiology) and is a certified Lean Six Sigma Black Belt and an accredited trainer. He can be contacted at andywalsh@clean6sigma.com.