
Cleaning Process Development: Cleanability Testing And "Hardest-To-Clean" Pharmaceutical Products
By Ruijin Song; Alfredo Canhoto, Ph.D.; and Andrew Walsh
 Part of the Cleaning Validation for the 21st Century series
Cleaning processes should not be adopted randomly or chosen simply based on what has been used in the past. They should be developed systematically with the intent of reducing the risk of cross-contamination and identifying optimal cleaning parameters for both the products and equipment to be cleaned. Cleaning processes that have been optimized through the selection of the most appropriate cleaning agents/parameters can reduce residues to the lowest risk level and provide a high assurance of safety to patients.
In the early days of cleaning validation, development of cleaning processes was rarely part of the validation process. Legacy cleaning procedures were typically validated as they already existed: acceptance limits were calculated, protocols were written, samples were taken, and a report was written. However, as described in the American Society for Testing and Materials (ASTM) E3106-18 “Standard Guide for Science-Based and Risk-Based Cleaning Process Development and Validation,” cleaning process development is now expected in the validation process.1 The standard is structured on ICH Q92 and also includes the three-step life cycle process from the FDA’s 2011 Process Validation Guidance.3 The FDA has always considered cleaning to be a process that should be validated like any other drug manufacturing process,4 and drug manufacturing processes require process development. FDA representatives have also stated that the 2011 update to this guidance applies to cleaning;5 therefore, cleaning process development is a requirement.
Today, most cleaning process development begins in the laboratory with bench-scale testing to develop the initial cleaning process knowledge and understanding necessary to facilitate its transfer and application at commercial scale. Many laboratory-scale studies can be performed quickly and easily, which will assist in cleaning process development, from simple “cleanability studies” to full factorial design of experiments. Laboratory-scale studies are quick and economical and provide valuable insights into the cleaning process. Laboratory-scale studies can answer typical cleaning validation questions such as:
- Which product is the hardest to clean?
- Which cleaning agent provides the best cleaning?
- Can we demonstrate that two cleaning agents are equivalent?
- Which cleaning input parameters are critical?
- What are the optimal cleaning parameter settings?
- How long does it take to clean the equipment?
- Are dirty-hold-time studies necessary at commercial scale?
ASTM E3106 defines cleanability as “the relative difficulty for cleaning a piece of equipment or product.” While the concept of cleanability is relatively new to the pharmaceutical industry, it has been used for many years in other industries.6 Laboratory studies can answer the questions above by measuring the cleanability of a product from an equipment material of construction (MOC) under various conditions using a surrogate surface of the same material. These surrogate surfaces are typically called “coupons.” An example of a coupon is shown in Figure 1.
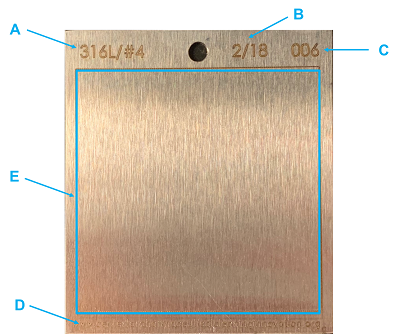
Figure 1: Example Coupon Used For Cleanability Studies. The coupon is 316L Stainless Steel with a #4 finish and engraved with (A) the MOC, (B) the date of manufacture, (C) the coupon number, and (D) the identification of the manufacturer. The test area (E) is inscribed and in this example is a 5 cm by 5 cm area. This coupon is compliant with ASTM standard G121.7
Cleanability Testing
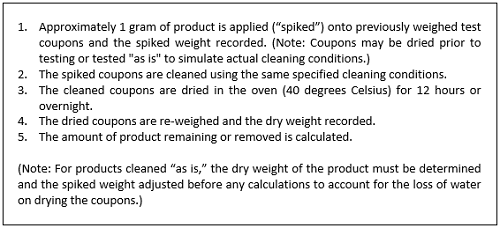
In brief, cleanability testing consists of applying products, or compounds, onto the surfaces of coupons, recording the weight of the product or compound applied, and then exposing the coupons to a simulated cleaning process. The coupons may be tested with products applied “as is,” or the products may be dried onto the coupons before testing to simulate equipment surface conditions prior to cleaning. Replicate coupons for each product are necessary if a statistical analysis is desired. The simulated cleaning process may be performed in a beaker or other type of model system. The coupons are then removed and examined to determine how much product was removed or remains on the surface and the significance of the result. By comparing the cleanability data obtained for different products, for different cleaning agents, or for different cleaning parameters or conditions, answers to the seven questions above can be readily obtained. Table 1 gives a step-by-step example of this process.
Table 1: Example Of A Basic Cleanability Test Procedure
(Note: While this article is focused only on the removal of chemical residues, much of the approach described can be applied to the evaluation of disinfectants for the reduction and control of bioburden.)
Apparatuses Used For Cleanability Testing
In the pharmaceutical, biotech, and medical device industries, cleanability testing has generally used fairly crude and manual approaches (Figure 2). These procedures are simple and inexpensive but can be time- and resource-consuming. Since they are largely performed manually, there is a much higher risk of variability in the data, which may lead to unreliable results.8 This problem may be compounded when there are many analyses to perform, with multiple product types, involving multiple analysts.
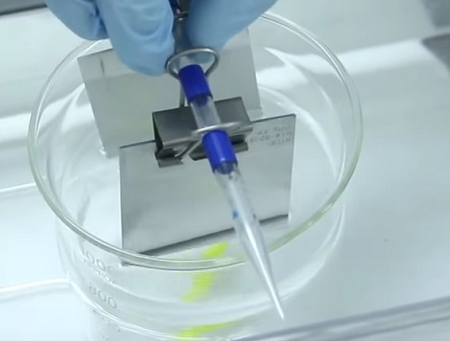
Figure 2: Simple Manual Beaker Test Technique. Here coupons are attached to pipette tips and held in place with binder clips. They are manually inserted into a beaker containing the test solution at a specified temperature and agitation and manually removed at a specified time. This procedure requires an analyst to be present to monitor the test so the coupons can be removed at the correct times. This approach has issues with variability of the test results as the timing of removing the coupons, maintaining the temperature of the test, and the control of agitation are potential sources of variation.
A limited number of publications on alternative approaches for determining the cleanability of various products discuss other model systems and apparatus.8, 9, 10 A short review article provides a survey of the types of test apparatuses that have been used by various companies.11 In that article these different types of devices are described for use in determining cleanability and characterized as “residue-immersion,” “residue-dipping,” or “cleaning-agent-flow.” These laboratory-scale apparatuses range from crude and simple manual approaches (Figure 2) to more complex and even automated approaches (Figure 3). These devices allow multiple test coupons to be run simultaneously and provide finer control over test conditions than the manual method. More recently, an automated, high-throughput device for testing cleanability was developed by the Center for Pharmaceutical Cleaning Innovation, LLC in collaboration with Astra Tech, LLC that allows independent control, monitoring, and recording of test parameters for multiple test stations (Figure 4). A major advantage of automated approaches is that direct comparison of the test coupons after a standardized test is possible.
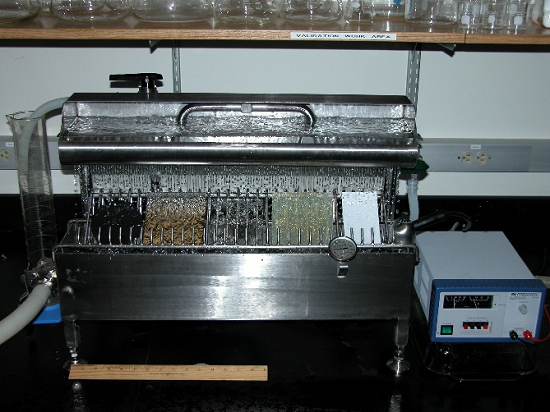
Figure 3: Example Of A “Cleaning-Agent-Flow” Test Apparatus. This device provides a method to study how residues are removed from surfaces by simulating the cascading flow effect on a tank wall. Coupons are placed on a 45-degree angle in the device, and the cleaning agent contained in the tank above is allowed to cascade over them. The cleaning agent can be recirculated back into the storage tank or directed straight to the drain. As shown here, coupons of several different MOCs can be tested simultaneously (patent number 7,490,508).
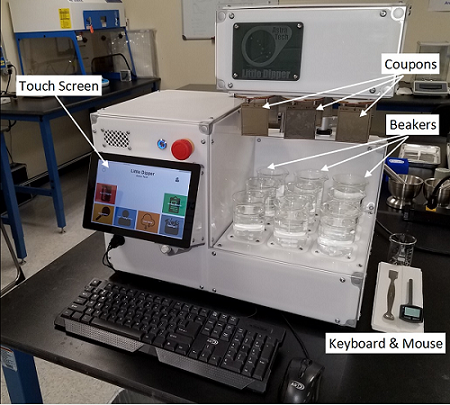
Figure 4: Automated High-Throughput Cleanability Testing Device. This device, designed and built by Astra Tech (astratechusa.net/home), is microprocessor-controlled, runs under a Windows 10 IoT Core, and can run multiple programs while independently controlling and monitoring up to nine test stations. Reports containing time, temperature, and RPM (or Reynolds number to measure turbulence) data are generated for every run and can be downloaded for analysis. The device has a 10-inch touch screen for program selection and parameter entry, or a keyboard and mouse can be used. Test coupons are attached to one of the nine test stations (patent pending).
Analytical Methods For Measuring Cleaning Effectiveness
Once the coupons have been exposed to the cleaning process, the overall effectiveness of the cleaning of the product or compound needs to be measured in some way. A few qualitative or quantitative methods are used:
- Visually clean (qualitative)
- Water-break free (qualitative)
- Gravimetric method (quantitative)
- Analytical methods (quantitative)
Visually Clean Method: This qualitative method evaluates the test coupons after the cleaning test is completed to determine whether there is any remaining residue that can be seen. Coupons are then graded for cleanliness using an ordinal scale, which currently has no industry standards and is typically developed by the company doing the testing. In some cases, the cleaning test is continued until no visible residues are detected by the analyst. This can result in long test times with multiple cleaning steps. The significance of the visually clean criteria can be questionable, as coupons that have passed the visually clean criteria have been found to have measurable residues still present (Figure 5). It is understood that analytical limits for cleaning may be well under the visual limit and would exclude the use of visually clean in these cases.
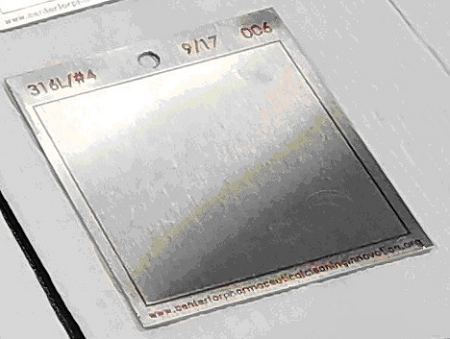
Figure 5: Coupon With Residue That Is Visually Clean. This coupon passed the visually clean criteria. However, gravimetric analysis revealed 4 mg of total residue on the coupon.
The sensitivity of visual inspection is also in debate and known to be specific to the products or compounds themselves. Visual residue limits (VRLs) have been reported from 10 µg/cm2 down to 0.1 µg/cm2, making any comparison of results between products or compounds difficult.12, 13 Most of these studies have made rough estimates of the VRLs, but a few statistically based techniques have been described to more accurately determine the VRL of product or compounds.14, 15
Water-Break Free Method
This is another qualitative method that evaluates the test coupons after the cleaning test is completed to see if there is evidence of residues on the surface. An ASTM method was developed for the detection of the presence of hydrophobic (nonwetting) films on surfaces and the presence of hydrophobic organic materials in processing environments.16 The ASTM water-break free test was developed as an in-process verification of the absence of surface contaminants on metal surfaces that may interfere with subsequent surface treatments such as priming, conversion coating, anodizing, plating, or adhesive bonding and not specifically for pharmaceutical products. This test method is not quantitative and is restricted to applications where a go/no-go evaluation of cleanliness will suffice. The test is only valid for residues of products or compounds that are hydrophobic, so this would exclude the many pharmaceutical products which are hydrophilic. The test also requires that the water and test materials have been certified to be free of hydrophobic or hydrophilic substances prior to testing. The residues of hydrophilic substances on the surface of the coupons to be tested may result in passing results even though residues are present. Rough or porous surface conditions of the coupon may also interfere with this test. The repeatability of this test method requires that inspectors have been trained in the observation of surfaces for water breaks.16 In addition, this method cannot be used with MOCs that have hydrophobic surfaces, such as many plastics used in pharmaceutical operations (HDPE, Teflon, etc.). As with the visually clean method, the cleaning test may need to be continued until the water-break free test passes, which can also result in long test times.
Gravimetric Method
This quantitative method measures the amount of residue removed from or remaining on the test coupons after the cleaning test. In the ASTM method G122 “Standard Test Method for Evaluating the Effectiveness of Cleaning Agents,”17 a quantitative measure called the cleaning effectiveness factor (CEF) is derived from the study data. Two or more coupons made of the MOC of the equipment are weighed and then coated with the products being tested and weighed again. These coupons are then subjected to the test conditions and reweighed after the test. The difference in weight can tell you either how much product was removed or how much remains (see Table 1). The gravimetric method can detect residues on coupon surfaces down to the mg to µg/cm2 level.
Analytical Methods
There are quantitative methods, such as high-performance liquid chromatography (HPLC) and total organic carbon (TOC) analysis, that can measure very low amounts of residue remaining on the test coupons after the cleaning test. These methods can detect traces of residues on coupon surfaces down to low µg/cm2 levels. The ability of these methods and their sample collection methods (usually swab) to recover the residues needs to be determined. Digital image processing and analysis software may also prove helpful in evaluating the removal of residues by analyzing the test surface before and after cleaning.
Test Methods For Determining Cleanability
In the gravimetric method, the CEF values are calculated from the weights of coupons before and after cleaning, as shown in Equations 1 and 2.
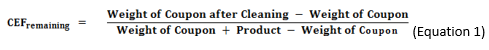
Alternatively, the amount of material remaining may be calculated also.

(Note: Either of these ratios can be multiplied by 100 to get the percent remaining or percent removed.)
Depending on the test conditions, different products will have different CEF values. These CEFs can be used to help answer the seven questions listed above and can also be used to rank process residues based on actual quantitative data. These studies should be performed following ASTM G121 “Standard Practice for Preparation of Contaminated Test Coupons for the Evaluation of Cleaning Agents,” which was recently updated to include pharmaceuticals, biologics, nutraceuticals, cosmetics, and medical devices in its scope. CEF data can be obtained from these studies using gravimetric methods, or residue data can be obtained using analytical methods such as TOC or HPLC. These CEF/analytical data can be evaluated statistically to determine whether there is a difference between two (or more) products along with the degree of that difference.
In this first part of the series, we will show how cleanability testing and the CEF can be used to easily answer the first question.
Question 1: “Which product is the hardest to clean?”
Most pharmaceutical facilities manufacture more than one product, and many facilities can manufacture dozens or even more than 100 products. These facilities will also have dozens, if not more than 100, pieces of equipment. Regulators have long understood that performing cleaning validation for every product and every piece of equipment would take companies many years to complete. Companies suggested, and regulators agreed, that performing cleaning validation for a worst-case scenario should be sufficient. So, for a facility which had multiple products manufactured on the same equipment, instead of doing cleaning validation on each product, the “hardest-to-clean” product would be selected for cleaning validation and would represent all the products.
Of course, regulators have required a justification for the selection of any worst-case scenario. The question arose as to how to determine which products are the hardest to clean. Since there is no formal definition of hardest-to-clean products, companies have turned to several criteria for selecting them such as solubility, potency, and toxicity of the API, as well as operational experience with the products. Currently, several regulatory guidances have listed solubility, toxicity, potency, and operational experience (some now include cleanability) as approaches to determine the hardest-to-clean product.18, 19
However, a quantitative, scientific method is needed for the determination of hardest-to-clean products. The approaches that have been suggested as indicators of hardest to clean, such as solubility, viscosity, potency, and toxicity, may not be reliable or even justifiable. Cleanability testing, combined with statistical analysis of cleanability data, can provide such an objective and quantitative alternative to these older approaches.
Figure 6 shows a comparison of typical cleanability data (CEF remaining) for two products. Coupons were prepared in triplicate for both products and tested under the same cleaning conditions. The CEFs were calculated for both products, and the results compared using a “two sample t-Test” in Minitab 18. The two-sample t-Test is a statistical analysis designed to test if there is a difference between two means from two different populations of data. For this cleanability test, there was more residue remaining on the coupons for Product A than for Product C. The graph shows 95 percent confidence intervals for the means of the data, and there is no overlap, indicating the means are different. Finally, we can see if the difference between the means is statistically significant by comparing the p-value for the significance level. The typical significance level of 0.05 was used here. A P-Value <0.05 indicates a <5 percent risk of concluding there is a difference between Product A and Product C when none exists. The P-Value of 0.003 indicates a high degree of assurance that Product A is harder to clean than Product C. In this case, we can clearly see that the cleanability data for the two products are different, the results are statistically significant, and Product A is harder to clean than Product C.
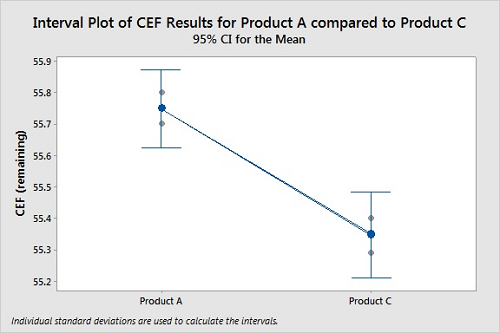
Figure 6: Two-Sample T-Test For Product A Vs. Product C.
N Mean StDev SE Mean
Product A 3 55.7500 0.0500 0.029
Product C 3 55.3467 0.0551 0.032
Difference = μ (Product A) - μ (Product C)
Estimate for difference: 0.4033
95 percent CI for difference: (0.2667, 0.5400)
T-Test of difference = 0 (vs. ≠): T-Value = 9.39 P-Value = 0.003
Figure 7 shows a plot of cleanability data for two products. Again, the CEFs were determined in triplicate for both products. For this cleanability test, the residue levels on the coupons for Product A and Product B appear similar. The 95 percent confidence intervals for the means of the data overlap significantly, indicating the means are probably not different. The P-Value of 0.943 indicates it is very unlikely that Product A is harder to clean than Product B. In this case, we cannot see any difference in the cleanability data between the two products, the results are not statistically different, and we cannot claim Product A is harder to clean than Product B.
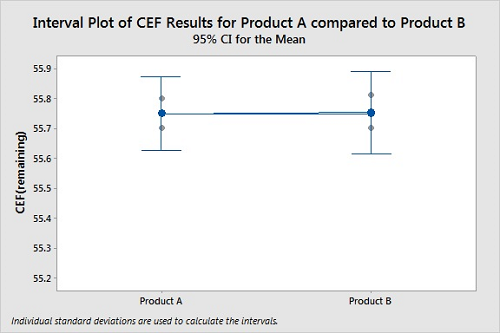
Figure 7: Two-Sample T-Test For Product A Vs. Product B.
N Mean StDev SE Mean
Product A 3 55.7500 0.0500 0.029
Product B 3 55.7533 0.0551 0.032
Difference = μ (Product A) - μ (Product B)
Estimate for difference: -0.0033
95 percent CI for difference: (-0.1400, 0.1333)
T-Test of difference = 0 (vs ≠): T-Value = -0.08 P-Value = 0.943
Several products can be compared at the same time using ANOVA (analysis of variance). ANOVA is a convenient way to compare the means of multiple sets of data, which avoids the problem of increasing the probability of Type I errors using multiple t-Tests if we were to compare the data sets one at a time. In this case, we might believe there is a difference between the cleanability of two products when there is none. Figure 8 shows a graph from an ANOVA analysis of the cleanability data for six products. All six were tested using the same conditions (time, temperature, etc.).
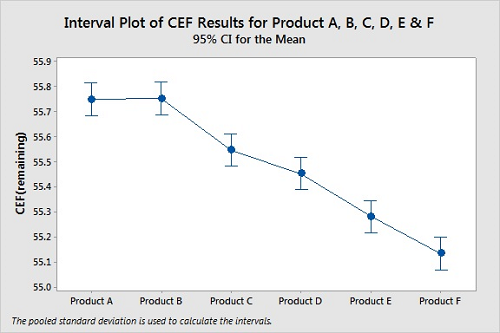
Figure 8: Interval Plot Of Products A, B, C, D, E, And F.
Means
Factor N Mean StDev 95 percent CI
Product A 3 55.7500 0.0500 (55.6848, 55.8152)
Product B 3 55.7533 0.0551 (55.6881, 55.8186)
Product C 3 55.5467 0.0551 (55.4814, 55.6119)
Product D 3 55.4533 0.0551 (55.3881, 55.5186)
Product E 3 55.2800 0.0500 (55.2148, 55.3452)
Product F 3 55.1333 0.0451 (55.0681, 55.1986)
Pooled StDev = 0.0518545 P-Value = 0.000
For these cleanability tests, the residue levels on the coupons for Products A, B, C, D, E, and F do not appear similar at all. However, the 95 percent confidence intervals for the means of the data overlap for Products A and B, for Products C and D, and possibly for Products E and F, indicating the means for these pairs may not be different. For this ANOVA, the P-Value of 0.000 indicates at least one of the means of these products is different from the others. While we can easily see that Products C, D, E, and F are easier to clean than both Products A and B, we cannot claim Product A is harder to clean than Product B from this analysis. However, there are additional tests for analyzing ANOVA results that can provide deeper insight into these results.
We can compare the confidence intervals for all possible pairs of the means and show any differences using Tukey's method.20 Figure 9 visualizes these comparisons, and we can quickly see that we cannot say Products A and B and Products C and D are different. But Products E and F are slightly different.
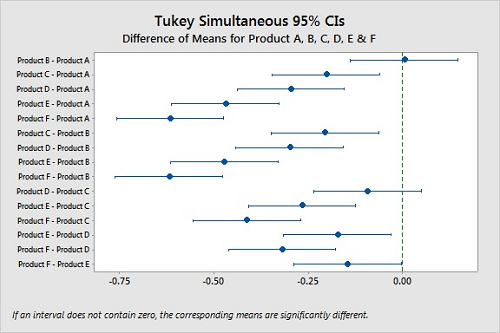
Figure 9: Tukey Simultaneous Confidence Intervals For Products A, B, C, D, E, & F.
With Dunnett's method,21 we can designate one product as a control group and compare the confidence intervals of the other products and look for differences. If a confidence interval contains zero, there is no significant difference between the two means under comparison. Figure 10 shows these comparisons using Product A as the control, and while again we cannot say that Products A and B are different, it is clear that Products C, D, E, and F are different from Product A.
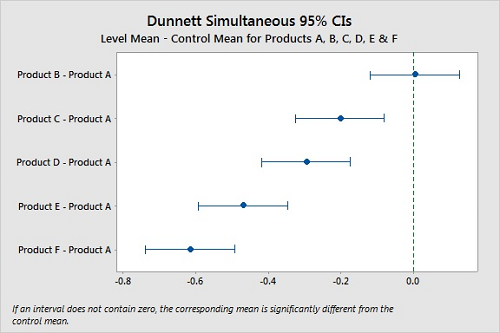
Figure 10: Dunnett Simultaneous Tests for Level Mean — Control Mean for Products A, B, C, D, E, & F.
Hsu's method22 will select the “best” group (product) and compare all the other groups (products) against it. In Hsu's the “best” is either the largest or smallest value, and this must be selected prior to the analysis. Since we are interested in the hardest to clean, this would be the largest value (most residue remaining). In Hsu's test, if a confidence interval has zero as an endpoint, the product is significantly different from the best product. Figure 11 shows these comparisons and, like in Dunnett's, we cannot say Products A and B are different, and it is clear that Products C, D, E, and F are different from Products A B (P-Values <0.05). Also, the P-Values for Product A and B are both 0.810, indicating very little difference between them. In this instance it would be justified to claim both product A and B are hardest-to-clean products, and both can be used for cleaning studies, which may simplify the validation.
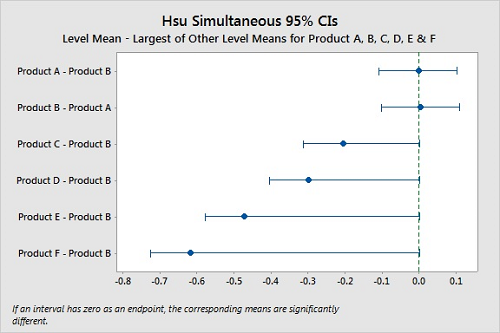
Figure 11: Hsu Simultaneous Tests For Level Mean — Largest Of Other Level Means For Products A, B, C, D, E, & F.
These simple statistical tools are readily available and can provide a great deal of insight into the cleanability of products from laboratory-scale data that is simple and easy to obtain.
Validation Of Cleanability Test Results
Any answers to the seven questions listed at the beginning using cleanability testing would be meaningless unless the results of the cleanability testing are representative of the results from an actual cleaning. As a test to confirm the validity of results of cleanability test studies, five semi-solid products were spiked onto coupons in triplicate and cleanability data were determined using the automated device shown in Figure 4. The same products were also spiked onto coupons in triplicate and cleaned in a small manufacturing vessel with an attached small-scale clean-in-place (CIP) system with a rotating spray ball (Figure 12). The test vessel is connected to a cleaning solution tank where different cleaning solutions can be prepared. The cleaning solution tank is insulated and can be heated to any desired temperature. This small-scale equipment was designed to allow the simulation of the cleaning of actual manufacturing equipment. Stainless steel rods were welded into the interior of the vessel to allow the spiked coupons to be suspended inside the vessel so they can be exposed to the CIP cycle and removed for analysis (Figure 13). Three coupons were prepared for each product and suspended at the top, middle, and bottom positions in the vessel to control for differences in cleaning at these locations.
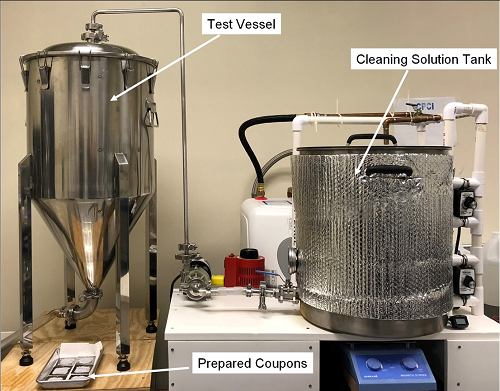
Figure 12: Model Manufacturing Vessel And CIP System.
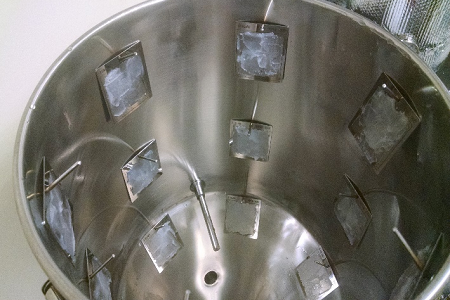
Figure 13: Inside Of The Manufacturing Vessel With Coupons Attached.
The data from the cleanability testing was then compared to the data from the CIP system test using regression analysis. The regression analysis showed a very good correlation between the results for the vessel cleaning compared to the cleanability test data (R-Sq [adj] = 98.7 percent), indicating the cleanability test is a good predictor of cleaning performance (Figure 14). It should be understood that the cleanability test data was from an immersion test performed in a beaker, while the CIP test data was from a rotary spray impingement test performed in a small manufacturing vessel. Although using a very different cleaning procedure, the cleanability test data still provided high predictability of cleaning performance in the manufacturing vessel.
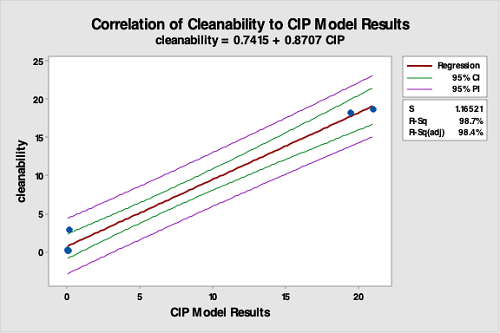
Figure 14: Correlation Of Cleanability Test Data To The CIP Run Test Data. The R-square is 98.4, indicating a very strong correlation between the bench-scale cleanability test data and the CIP run test data. This study strongly supports that cleanability testing is valid for selecting hardest-to-clean products.
Solubility, viscosity, toxicity, and potency data have been suggested as, and are used as, indicators of cleanability. The data from the CIP system testing was also compared to the solubility, viscosity, toxicity, and potency data for these products by regression analysis. However, as seen in the graphs below (Figure 15 to 18), there is no correlation between the data from the CIP system testing with any of these parameters, indicating these are not legitimate parameters to use for selecting hardest-to-clean products or predicting any other aspect of cleaning.
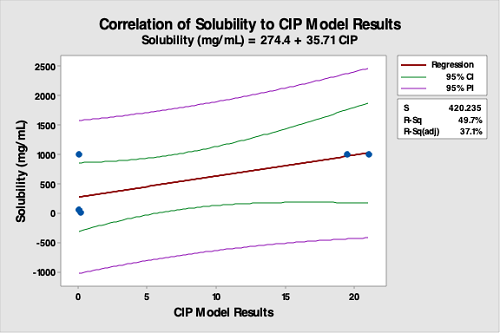
Figure 15: Correlation Of Solubility (Of API) Data To The CIP Run Test Data. The R-square (adjusted) is 37.1 percent, indicating a very poor correlation between API solubility data and the CIP run test data. This analysis demonstrates API solubility is not valid for selecting hardest-to-clean products. This is especially true for formulated products where excipients are typically responsible for cleaning difficulty. However, solubility may have use for API manufacturers.
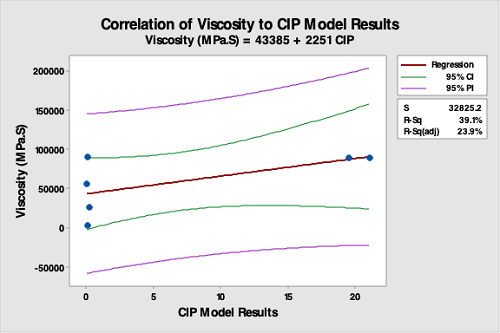
Figure 16: Correlation Of Product Viscosity Data To The CIP Run Test Data. The R-square (adjusted) is 23.9 percent, indicating a very poor correlation between product viscosity data and the CIP run test data. This analysis demonstrates that product viscosity is not valid for selecting hardest-to-clean products.
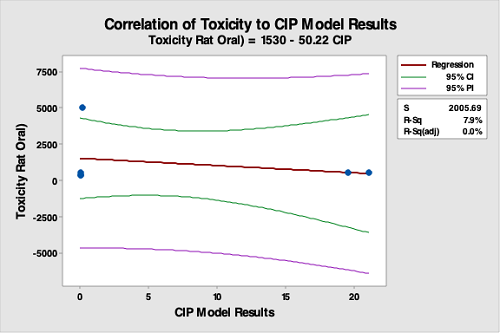
Figure 17: Correlation Of API Toxicity Data To The CIP Run Test Data. The R-square (adjusted) is 0.0 percent, indicating no correlation between API toxicity data and the CIP run test data. While toxicity may be used for selecting limits, this analysis demonstrates that the toxicity of an API is not valid for selecting hardest-to-clean products.
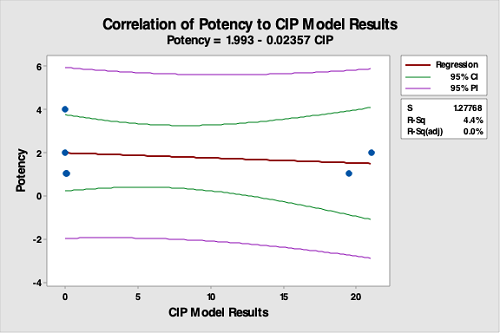
Figure 18: Correlation Of Potency Data To The CIP Run Test Data. The R-square (adjusted) is 0.0 percent, indicating no correlation between potency data and the CIP run test data. This was expected, as the strengths of the products were either 1, 2, or 4 percent. This analysis demonstrates that potency is not valid for selecting hardest-to-clean products.
Based on the above analysis, it is clear that criteria such as solubility, viscosity, toxicity, and potency should no longer be used for the selection of hardest-to-clean products, and a quantitative and objective criterion such as cleanability should replace them.
Summary
Cleanability is clearly an important parameter for determining the hardest-to-clean product for use in cleaning validation studies, and reliable methods for this determination are needed. For any analysis, quantitative methods should be preferred over qualitative methods as they are scientific, not subjective, and allow the easy application of statistical evaluation. For cleanability the most commonly used method, which is relatively inexpensive and the easiest to use, is the gravimetric method, as it only requires an analytical balance. The gravimetric method yields information-rich data that can be statistically analyzed very easily. Moreover, this method can be performed much faster than a qualitative method. Analytical methods, like TOC and HPLC, require expensive equipment and are harder to use, so they are typically used only to supplement gravimetric methods when residue levels are below the sensitivity of the gravimetric method (<0.1 mg).
Figure 19 shows the cleaning curves for three products for the same cleaning. The curves reflect the degree of their difficulty to clean. Product 1 (green curve) is easy to clean and follows an exponential curve. Product 3 (red curve) is harder to clean and follows a sigmoid curve. (Exponential and sigmoid curves are common in cleaning.) Product 2 (orange curve) is somewhat in between. As shown by the vertical line, the hardest to clean of these three products can be determined using a gravimetric test in about 3 minutes, while qualitative tests may take in excess of 20 minutes and may not be able to easily distinguish whether Product 2 and 3 are truly different. As demonstrated above, simple statistical analyses can be used to classify which products are hardest to clean and even rank them by difficulty. Additionally, this can be done rapidly and easily.
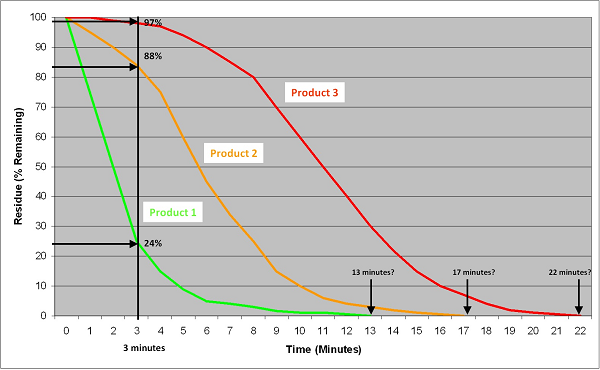
Figure 19: Comparison Of Quantitative Methods Against Qualitative Methods For Determining A Hardest-To-Clean Product. This graph plots the cleanability data of three products: a relatively easy-to-clean product, a moderately difficult-to-clean product, and a more difficult-to-clean product. Using the quantitative gravimetric method, the hardest-to-clean product can be easily determined in only 3 minutes for multiple products at the same time. Using qualitative methods (visually clean or water break-free test), the analysis time varies with each product. In practice, these methods can take 45 to 60 minutes to complete. The endpoint may also be difficult to call considering the issues discussed above.
This article has shown laboratory-scale cleanability testing provides valuable and valid information about actual cleaning, while other commonly used criteria do not.
The other articles in this series will explore how cleanability testing can answer the other six questions posed at the start of this article and demonstrate how cleanability testing can be quickly and easily used to design or improve full-scale cleaning procedures, saving time, energy, and resources.
Peer Review:
The authors wish to thank our peer reviewers — Bharat Agrawal; Thomas Altmann; Ralph Basile; Sarra Boujelben; Gabriela Cruz, Ph.D.; Mallory DeGennaro; Kenneth Farrugia; Ioanna-Maria Gerostathi; Igor Gorsky; Jessica Graham, Ph.D.; Miquel Romero Obon; Laurence O’Leary; Osamu Shirokizawa; and Siegfried Schmitt — for reviewing this article and providing insightful comments and helpful suggestions.
References:
- ASTM E3106-18 “Standard Guide for Science-Based and Risk-Based Cleaning Process Development and Validation” https://www.astm.org/Standards/E3106.htm.
- International Conference on Harmonization of Technical Requirements for Registration of Pharmaceuticals for Human Use, ICH Harmonized Tripartite Guideline, Quality Risk Management — Q9, Step 4, 9 November 2005, http://www.ich.org/fileadmin/Public_Web_Site/ICH_Products/Guidelines/Quality/Q9/Step4/Q9_Guideline.pdf.
- FDA Guidance for Industry: Process Validation: General Principles and Practices January 2011, FDA, www.fda.gov/downloads/Drugs/.../Guidances/UCM070336.pdf.
- FDA Guide to Inspections: Validation of Cleaning Processes, July 1993, FDA, www.fda.gov/iceci/inspections/inspectionguides/ucm074922.htm.
- International Pharmaceutical Quality (Clarifying Questions Upfront is Key in Process Validation, US and EU PV Principles in Alignment, CDER’s McNally). https://www.ipqpubs.com/2015/10/29/clarifying-questions-upfront-is-key-in-process-validation-us-and-eu-pv-principles-in-alignment-cders-mcnally-stresses/.
- Attilio L. Bisio, Henry B. Linford, And Edward B. Saubestre, “Cleanability and Oils-Spreading Rates” Industrial and Engineering Chemistry April 1956, Pages 798-801.
- ASTM G121 “Standard Practice for Preparation of Contaminated Test Coupons for the Evaluation of Cleaning Agents.”
- Rathore, Nitin; Wei Qi; Cylia Chen; Wenchang Ji “Bench-Scale Characterization of Cleaning Process Design Space for Biopharmaceuticals” Biopharm International; Mar 2009.
- Canhoto, Alfredo J., Rod J. Azadan, John Putnam, Michael Kreuze, Brian E. Williams, Kristen E. Nobles, Jeffrey Chapman, and Kelli Y. Barrett. “A novel bench scale apparatus to model and develop biopharmaceutical: Cleaning procedures.” Journal of Validation Technology 11, no. 1 (2004): 16-24.
- Sharnez, Rizwan, Justin Lathia, David Kahlenberg, Sunil Prabhu, Michael Dekleva “In Situ Monitoring of Soil Dissolution Dynamics: A Rapid and Simple Method for Determining Worst-case Soils for Cleaning Validation” PDA Journal of Pharmaceutical Science and Technology Vol. 58, No.4, July-August 2004.
- Pluta, Paul L, “Laboratory Studies in Cleaning Validation” Journal of Validation Technology; Aug 2007.
- Forsyth, Richard J., Vincent Van Nostrand, and Gregory P. Martin, “Visible-Residue Limit for Cleaning Validation and its Potential Application in a Pharmaceutical Research Facility” Pharmaceutical Technology 28(10):58-72, October 2004
- Desai, Parth and Andrew Walsh, “Validation Of Visual Inspection as an Analytical Method For Cleaning Validation” Pharmaceutical Online, September 2017.
- Ovais, M., “Statistically Justifiable Visible Residue Limits,” Pharmaceutical Technology, March 2010, Vol. 34, Issue 3, pp. 58-71.
- Walsh, Andrew, Dongni (Nina) Liu, Mohammad Ovais, “Justification and Qualification of Visual Inspection for use in Cleaning Validation for a Low Risk, Multi-Product Facility” Pharmaceutical Online, August 2018.
- ASTM F26359 “Standard Test Method for Hydrophobic Surface Films by the Water-Break Test.”
- ASTM G122 “Standard Test Method for Evaluating the Effectiveness of Cleaning Agents.”
- EU Guidelines for Good Manufacturing Practice for Medicinal Products for Human and Veterinary Use Annex 15: Qualification and Validation.
- Active Pharmaceutical Ingredients Committee (APIC), “Guidance On Aspects Of Cleaning Validation In Active Pharmaceutical Ingredient Plants” September 2016.
- Tukey, John “Comparing Individual Means in the Analysis of Variance”. Biometrics. 1949 5 (2): 99–114.
- Dunnett C. W. “A multiple comparison procedure for comparing several treatments with a control”, Journal of the American Statistical Association, 1955 50:1096–1121.
- Hsu, Jason “Stepwise multiple comparisons with the best” Journal of Statistical Planning and Inference November 1992 Volume 33, Issue 2, Pages 197-204