
Best Practices In Environmental Monitoring Sampling — Transportation & Analysis
By Allan Marinelli, Quality Validation 360 Inc.
Due to globalization, restructuring of organizations, and the emergence of fast-paced technologies, companies need efficient and effective methods for validation, especially when establishing a defendable environmental sampling plan (the performance qualification [PQ] phase). This is especially true because there is a higher probability for regulatory agencies to scrutinize the documentation process during inspection when companies attempt to obtain licensure of their facility for the manufacturing of their products.1
As far as establishing a defendable environmental monitoring (EM) sampling plan within the PQ phase, six phases can be proposed to increase the likelihood of success during inspection for licensure of the facility. However, the extent of assimilating the suggested information is commensurate with the risk of the manufacturing process applications controlled under the relevant regulatory agencies and intended uses. I have provided a generic example of the elements suggested to attain successful inspection, but some companies may need less planning while others may need more.
The previous two EM articles — “3 Prerequisites To Establishing An Environmental Monitoring Sampling Plan” and “Sampling Preparation & Execution Best Practices For Environmental Monitoring” — covered phases1 through 3. This article will focus on the remaining phases (4 to 6).
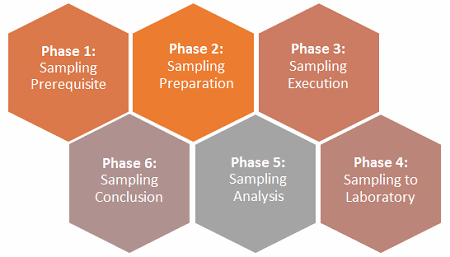
Figure 1: The six phases of an environmental monitoring sampling plan
After taking the samples from the specified locations and transporting them to the laboratory, the following steps are recommended:
1. Prepare the samples for incubation by scanning the labels on them provided the company has scanning capabilities or simply incubate.
a. Set the samples for incubation.
i. At the end of each day, verify that the collected microbe samples were sent for incubation in accordance with the EM program or validation EM plan.
ii. The incubator should be set in the stabilization temperature range of 30 to 35 degrees Celsius. Per manufacturers’ recommendations, some Agar plates (typically 9 cm and 14 cm) must be incubated upside-down while other Agar plates (typically 5.5 cm) are to be incubated in the normal orientation (lid facing upward).
2. Prior to the next sampling session, clean and sanitize the instruments, including the sampling trolley.
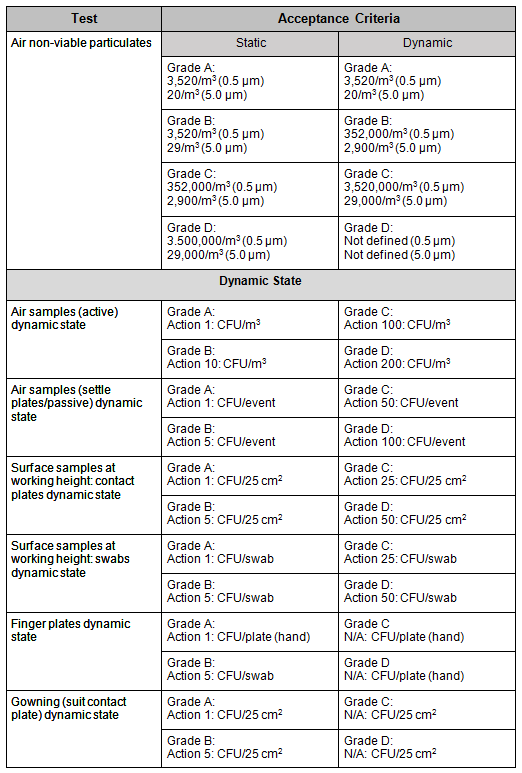
3. Analyze the samples in accordance with the company’s standard operating procedures and ensure the acceptance criteria is met. See Table 1 for test conducted versus acceptance criteria requirement based on room area classification with respect to the drawings in Part 2 of this article series.
Table 1: Example of PQ Environmental Monitoring Guidelines2
Phase 5: Sampling Analysis
In this phase, you need to establish appropriate alert limits for microorganisms and nonviable particles relative to classified and controlled areas in manufacturing. These limits are determined using historical data, which is typically taken by combining baseline geometric/four corners of the room data points and predictive personnel/material flow direction within the rooms as a function of room classifications. The limits should be re-evaluated regularly and coupled with previous validations, so a routine EM program can be subsequently implemented post-validation.
EM data is not normally distributed, but the data profile represents a skewed distribution, with many zeros and low or high values. Sample points within a classification area may be treated as individual groups or grouped by functionality and criticality (e.g., floor, airlocks, and other sample points).
The following sequences is suggested:
1. Establish alert and action limits.
When calculating 95 percent quantiles, either the empirical or parametrical method can be used to establish the calculation of limits for classified areas.
Various approaches can be used to calculate the 95th percentile on a data set:
- Based on sample data
- For example, the top 95 percent of the data set while selecting the minimum or average of the resultant set
- Assume normal distribution
- For example, the 95th percentile is approximately two standard deviations above the mean.
- R quantile
- For example, you can use the 95th percentile where the observed values fall within the calculated range.
- Excel’s approach
- For example, you can use appropriate mathematical functions or pre-established equations based on the company’s historical data or data categorization patterns to ultimately meet the intent.
However, in the pharmaceutical and biopharmaceutical industries, typically upon historical analysis of observed data/received, the data falls within a logarithmic normal distribution fitted to data scenario.
For grades A and B, the empirical method is recommended, whereas for grades C and D the parametrical method is recommended. Using a parametric method, 95 percent quantiles are obtained from a distribution (logarithmic normal — a continuous probability distribution of random variable whose logarithm is normally distributed3 — distribution fitted to data, which represents data) that requires a small amount of data set, typically at least 20 observations. In contrast, the empirical method would require at least 50 percent of the observations that result in being typically zero.
The process of deciphering the alert and action limits is indicated below as a reference:
- Ninety-five percent quantiles are estimated directly from the observed data. In other words, it is the result where 95 percent of the observations are below the calculated value.
- Alert limits are derived as 95 percent quantiles of either 95 percent estimates from observed data in which the output results are rounded to integer numbers when output fractional numbers occur or depending on previous historical distribution output results. It can be suggested that alert limits be set at equal to or below 75 percent, but as additional data is subsequently gathered, alert limits can be re-adjusted accordingly to better represent the data in alignment with actual field conditions.
- Action limits are to be established using the company’s statistical program by data compilation of historical results in combination with the congruence of regulatory authorities prior to and/or during inspection of their facility.
- Re-evaluation of limits: It can be recommended that every two years or so the limits be re-evaluated even if there are no changes in room layout, equipment, and maximum number of personnel per room during batch or manufacturing operations. Conversely, if there are any additional machines/equipment throughout the facility or the rooms have been upgraded, establishing EM data coupled with re-evaluating the limits should be done prior to and after the upgrade for baseline comparison while re-adjusting the limits accordingly.
2. EM Data Trending Analysis
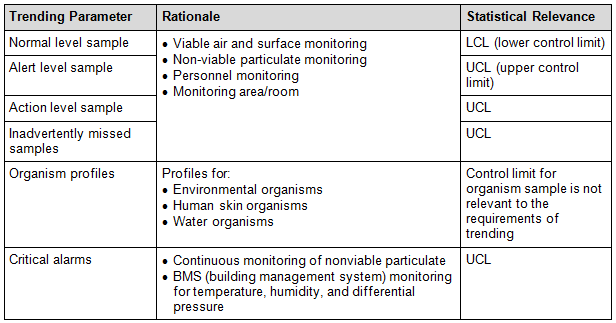
Various trending parameters can be factored in as identified in Table 2. But it is not an exhaustive or restrictive list, as this is dependent on the company’s user requirement specifications, standard operating procedures, and/or validation outcome:
Table 2: Example of a Monitoring Trending Analysis Table
The process in this section entails the following suggestions:
- General requirements include trending parameters, area to trend, and control limits. The control limits (historical data obtained during a two-year interval and post re-evaluation period) are subdivided as:
- Overall summary of control limits by area (viable air, non-viable particulates, viable surface) and handling adverse trends
- Assessments of adverse trends for normal level, alert level, action level, and missing samples as applicable and
- list alert and action level samples
- Organism profile
- Continuous non-viable particulate monitoring alarm trending
- BMS alarm trending
- Action items and follow-up toward closure
Phase 6: Sampling Conclusion
In this phase, write an EM report using the company’s report template that encompasses all results in either tabular method (tables, Excel spreadsheets) or other relevant methods (graphical, pictorial figures, flowcharts) while factoring in all encountered excursions or deviations and how the resolutions were derived toward closure or completion of the EM validation project.
References:
- Allan Marinelli, “A Workable Sampling Plan Using a Quality Risk Management Approach Relative to the PQ Phase of the Upgraded Purified Water Generation System at the Pilot Plant/Small Scale Level-A Validation Engineering Perspective,” Journal of Validation Technology (JVT) and Network, 18 Jun 2014
- Tim Sandle, ”Aseptic and Sterile Processing, Control, Compliance and Future Trends,” Chapter 11, page 517, edited by Tim Sandle and Edward C. Tidswell
- https://en.wikipedia.org/wiki/Log-normal_distribution
Note: A version of this article will appear in an upcoming revision of the book Environmental Monitoring: A Comprehensive Handbook, to be published by the PDA/DHI (Parenteral Drug Association/Davis Healthcare International).
About The Author:
 Allan Marinelli acquired over 25 years of worldwide cGMP experience in Belgium, France, South Korea, China, India, Canada, and the U.S. under the FDA, EMA, SFDA, KFDA, WHO, and other regulators. He is currently the president/CEO of Quality Validation 360 Inc., providing consultation services to the (bio)pharmaceutical, medical device, vaccine, and food/beverage industries. Marinelli has authored peer-reviewed papers (Institute of Validation Technology) and chapters on validation, risk analysis, and environmental monitoring in PDA/DHI books, and chapters on cleaning validation in PDA/DHI books. In addition, Marinelli published peer-reviewed articles on Pharmaceutical Online, Bioprocess Online, and Outsourced Pharma in 2016, 2017, and 2018. He is an associate member of ASQ (American Society for Quality) and published an article in ASQ titled “Against the Grain, Standing your ground when senior majority rules” in Quality Digest (Aug. 2014). You can contact him at amarinelli360@gmail.com