
Validation Of Visual Inspection As An Analytical Method For Cleaning Validation
By Parth Desai and Andrew Walsh
 Part of the Cleaning Validation for the 21st Century series
U.S. Regulation 21 CFR 211.67 (b) (6) has required the "inspection of manufacturing equipment immediately before use" since 1979. In practice, pharmaceutical manufacturers have been releasing equipment based on a “visual" inspection for many years. Subsequently, the industry and even regulators have come to see this "inspection" as a "visual inspection" requirement. For example, the Pharmaceutical Inspection Co-operation Scheme (PIC/S) recommends “no quantity of residue should be visible on the equipment after cleaning procedures are performed.”
There have been only a few studies on visual inspection (VI). In 1993, Gary Fourman and Dr. Mike Mullen of Eli Lilly published an article in which they mentioned that spiking studies indicated many compounds were visible at approximately 100 µgrams/4 inch2 (or 4 µgrams/cm2).5 No details were provided on how the studies were performed or on what compounds. A year later, an article by Jenkins and Vanderwielen claimed to be able to see residues down to 1 µgrams/cm2 by using an additional light source. Six years later, in 2000, Frank Buscalferri et al, published an article where they claimed to see residues of several compounds down to approximately 0.4 µgrams/cm2.6 Then, from 2004 to 2014, Richard J. Forsyth, along with several others, published a series of articles that found a range of 0.4 to >10 µgrams/cm2 for several different compounds.7-11
The basic approach for conducting these VI studies has been “spotting” a known amount of residue onto a "coupon" or surrogate material surface. Analysts then observed the spiked surface under various specified viewing conditions, and the lowest amount of residue that all analysts could see was considered the visual detection limit (VDL) for that compound/product.
However, it has never been clear whether VI is reliable since it has never actually been validated. If VI can be validated, or qualified, then the use of this technique for release of equipment would be justified and might even be used in place of traditional swab methods, which take substantial amounts of time and resources to develop, validate, and perform.
As mentioned, the above approach used a “spotting” technique that may result in an easily visible deposit. There has been a question of whether actual residues typically deposit all in one spot. Another possible approach is to apply an even coating of residue on the material surface and see if analysts can see these residues at the same levels. If analysts could, that could lead to the validation of VI as an analytical method.
Three separate studies on VI were conducted at the Stevens Pharmaceutical Research Center at Stevens Institute of Technology from 2011-2013 to explore the accuracy, precision, linearity, and detection limits of VI and the possibility that VI could be validated as an analytical method for cleaning validation. The studies used techniques to achieve an even coating of a product residue.
Materials And Methods
- 6 cm by 6 cm "coupons" of 316L stainless steel with a #8 surface finish were prepared and supplied by Environmental Resource Associates, Inc. (Golden, CO).
- The product selected and spiked onto the coupons was an OTC sunscreen, as low-risk products would be most amenable for use with VI.
- Two techniques were used to evenly coat the coupon surface with a known amount of sunscreen: a technique using a syringe to manually apply an even coating to a 5 cm by 5 cm area and another technique using a spray-coating device. The manual technique was used in the first study, and the spray coater was used in the second and third studies.
- Two different sets of coupons were prepared, one being a standard set and the other an unknown set. Analysts had to compare the sets under defined viewing conditions and find the closest match. The potential benefit of using a visual standard is it provides a basis for visual measurement, since the analyst may not know what they are specifically looking for, nor what level they are seeing. This would be similar to comparing samples analyzed on an analytical instrument with an external standard or an acquired linearity curve. All the following studies used this type of approach.
- An Omega HHLM1337 handheld light meter was used to measure light levels.
Study 1
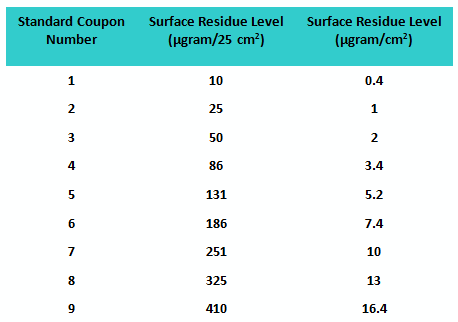
Sixty-eight graduate students in the Stevens Pharmaceutical Manufacturing and Engineering Program volunteered to participate in the first study. A set of nine coupons was prepared with known amounts of residue evenly deposited (manually) at increasing concentrations to be used as “standards.” An additional six sets of coupons were prepared at each of these same concentrations to be used as “unknowns,” for a total of 54 “unknown” coupons. The values of the residue levels are shown in Table 1.
Table 1: Standard Coupon Residue Levels for Study 1
The participants were provided minimal training before beginning the exercise to see how well they would do without specific instructions. The fitted line plot for the results can be seen in Figure 1.
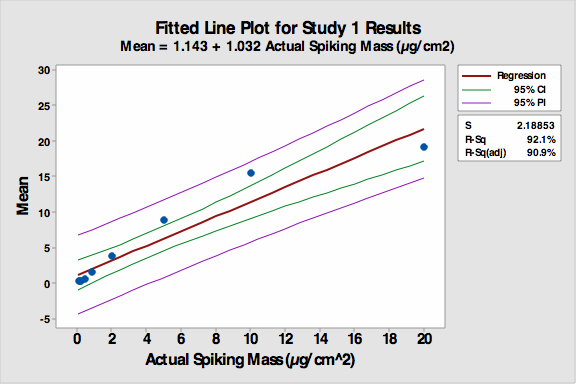
Figure 1: Fitted line plot for Study 1
The R-Sq (adj) was 90.9 percent despite the non-linearity of the first four coupons, which had significantly less residue spiked on them and were harder to see. Many students had difficulty distinguishing among these first four coupons. The accuracy of the VI increased as the concentration of residue increased.
There was fairly wide variation in the reported results. We made the following observations from our experience with this study:
- Since residues were deposited manually, there was some non-uniformity in the deposited residue, and this created some problems for analysts at the higher concentrations.
- Insufficient training of students was an issue. Students were not aware what the residue was supposed to look like (e.g., some students confused dust particles or scratches on coupons with residues). (Note: It is important to distinguish between student and industry-worker populations who have different levels of understanding; an industry worker should already know what visually clean equipment should look like.)
- A number of students reported questionable results and were requested to repeat the study. These students returned and repeated the study with different results, which were consistent with the expected values. These students offered plausible explanations for how they might have made errors in their results (e.g., a sloppily written “3” that looked like a “5”).
- A small number of students reported impossible results: highest scores for lowest standards and lowest scores for highest standards. These students were also requested to repeat the study and would not, so this data was discarded. (Note: This is an important observation as the results of a visual inspection in the industry are a matter of trust.)
- Like any set of standards, these coupons require a certain degree of care to prevent the residues on them from being damaged. These coupons require proper storage and handling to prevent dust, fingerprints, or other contamination from accumulating on them and altering their values and the analysts' responses.
Due to these issues, and the variation in results, it was decided that another study would be performed with the following modifications:
- A similar set of coupons would be manufactured using a spray-coating device in place of the manual method to deposit the residues. This was intended to standardize appearance, eliminate inter-coupon variability, and provide a more consistent presentation to the analysts.
- Provide documented training to the analysts on how to perform the visual inspection (e.g., coupon handling, inspection angle/distance, difference between residue and dust/scratches).
- Reduce the number of analysts to approximately 30.
Study 2
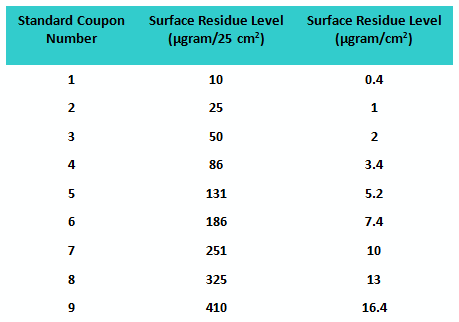
A second study was conducted with a population of 32 graduate students using the same number of “standard” and “unknown” coupons. However, this time, all coupons were prepared using a spray-coating device that applied a very uniform level of residue on the coupon surfaces. The values of the residue levels are shown in Table 2.
Table 2: Standard Coupon Residue Levels for Study 2
An SOP on how to handle the coupons and perform the visual inspection was created, and all participants were given documented training. All coupons were stored in a box between studies to minimize contamination (e.g., dust). The fitted line plot for the results can be seen in Figure 2.
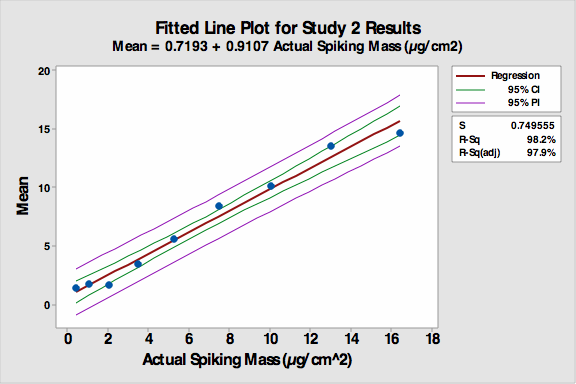
Figure 2: Fitted line plot for Study 2
The following observations were made from this study:
- The R-Sq (adj) increased to 97.9 percent despite the continued non-linearity of coupons 1 to 3.
- The precision and accuracy of the VI increased significantly compared to the first study including coupon number 4.
- However, it appeared analysts’ responses accumulated at the ends of the standard range. It was realized that the study design had restricted the students to reporting only 1-9 even if they thought a coupon was cleaner than 1 or dirtier than 9. It also forced them to select one of the standard values (no extrapolation), and this created a bias in the reporting of data. It should be noted that the bias on the low end results in “cleaner” coupons being reported as “dirtier.”
Study 3
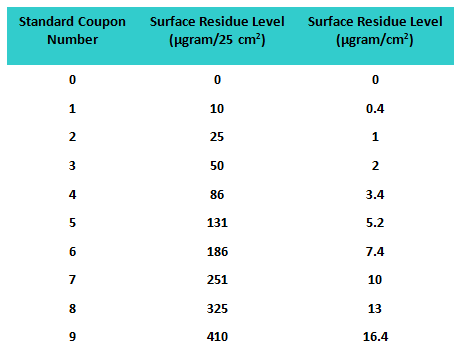
A third study was conducted allowing the participants to report higher or lower than the standard coupons based on what they observed, and a 10th coupon was added to the standards as a “blank” (i.e., no product was applied). Therefore, in this study a total of 60 coupons were used as “unknowns” for analysis. All coupons were again prepared using a spray device that applied residue uniformly on the coupon surfaces. The values of the residue levels are shown in Table 3.
Table 3: Standard Coupon Residue Levels for Study 3
For this study, the 10 “visual standard” coupons were affixed to a white panel and labeled 0-9. The 60 “unknown” coupons were affixed to 30 separate panels, each containing two “unknown” coupons. The "sample panels" containing the “unknown” coupon residue were compared to a "standard panel" containing the “standard” coupon residue for students to use to identify the values of the unknown coupon residues (Figure 3).
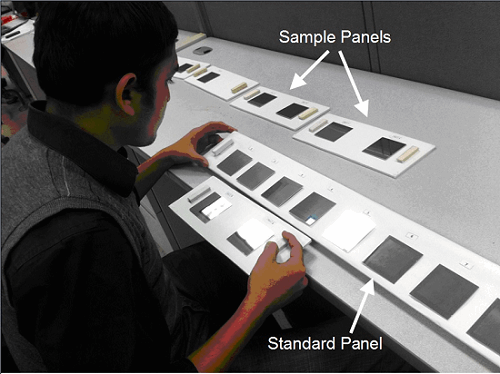
Figure 3: Student evaluating a pair of "unknowns" against the standard panel
Inspection Procedure
An SOP was written providing training on residue appearance, how to perform the visual inspection, and how to handle both the standard and unknown coupon panels. Thirty students were then trained on this SOP. The panels were laid out on a flat surface under normal indoor lighting to simulate typical manufacturing inspection conditions that might occur (for example, when inspecting cleaned packaging equipment on a wash cart).
The level of illumination during these experiments was determined and found to range from 63 to 93 foot-candles (680 to 1,000 lux). (Note: It was observed that light intensity varies considerably, even from one coupon position to another, so it should be understood that it is not possible to specify that a particular area, including a manufacturing area, is all at one lux level). During the evaluation of coupons, students were directed to sit in an upright position to make the visual angle between 30 to 90 degrees, similar to previously published conditions.6-10
During analysis, the students observed only the “unknown” coupon. If no residue was identified on the “unknown” coupon, it was reported as “0” meaning “clean”. If any residue was seen, the analyst then compared the amount of residue present on the “unknown” coupon with the amount present on the “visual standard” coupons. A value of 1-9 was then selected for the unknown coupon by choosing the closest match with the visual standard coupons; it was then recorded in the spreadsheet. If any residue was seen that did not match a standard, meaning a concentration greater than #9 (410 microgram/25 cm2), the analyst reported it as a 10 in the spreadsheet. All the data was collected in an Excel spreadsheet and then analyzed using Minitab 16 for accuracy, precision, linearity, and detection limit. The fitted line plot for the results can be seen in Figure 4.
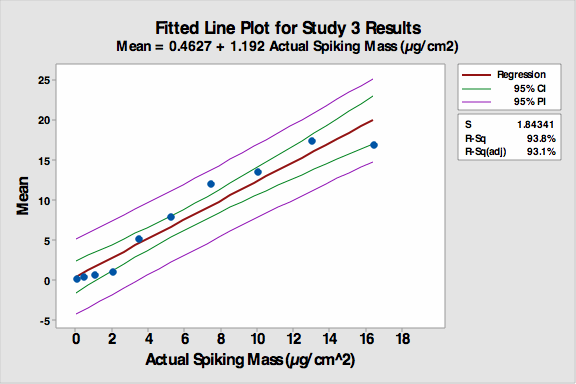
Figure 4: Fitted line plot for Study 3
The average responses of each “unknown” closely matched the standard values with an R-Sq (adj) value of 93.1 percent, showing a reduction from Study 2 but still indicating a very linear response. The first four responses (0.4 to 3.4 µgram/cm2) were essentially flat, indicating analysts in general did not “see” any residue on the first four coupons so they reported them as clean (0). Therefore, the amount spiked onto coupon number 4 (3.4 µgram/cm2) could be considered as a possible detection limit (DL) in this visual inspection study.
Accuracy and precision were evaluated for all “unknown” coupon levels by determining the mean and standard deviation and calculating the bias and the percent relative standard deviation (RSD).
Table 4: Bias and % RSD for Study 3
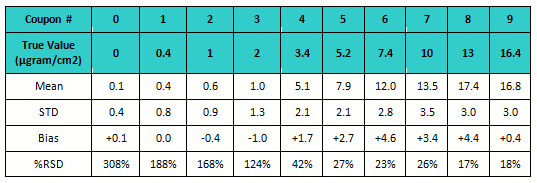
The data was also evaluated for percent RSD. The standard deviation is very high for the 4 lowest standards (see Figure 5) but then decreased substantially as concentration increased. The lowest standards were the most difficult to see and were under-reported. There was lower, but still significant, variation on the higher standards. These coupons had more drug residue present, and analysts could see them more easily but not distinguish between them very well.
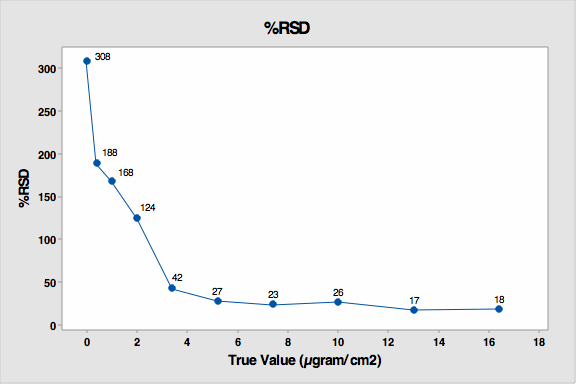
Figure 5: % RSD for Study 3
All of the higher standards (coupons 5 to 9) were reported higher then their actual values. For the purposes of cleaning verification, this would be a preferred bias.
This graph also reveals that from coupon number 5, the standard deviation markedly decreased. This indicates analysts were starting to more precisely see the residues on these coupons. So these results indicate that about 85 µgram/25 cm2, or 3.4 µgram/cm2 could be considered the DL for visual inspection in this study.
Calculation of Detection Limit
The DL was calculated based on ICH Q2 using the standard deviation of the response and the slope. The detection limit may be expressed as:
DL = 3.3 σ/ S
Where: σ = the standard deviation of the residuals and
S = the slope of the calibration curve
The estimate of slope (S) and the standard deviation (σ) were carried out from the regression equation and residual standard deviation obtained by plotting fitted line plot of the average response versus actual spiking mass (µgram), respectively. The slope, residual standard deviation, and calculated detection limits for each study are shown in Table 3.
Table 5: Calculated Detection Limits based on ICH Q2 for All Studies
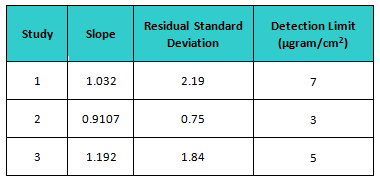
In the first study, students were given great latitude in how they performed the inspection, and the DL was the highest. With the second study, the students were provided much better instructions for their inspection, and the DL was more than cut in half. However, they were very restricted in how they reported their results, and when given more freedom the DL almost doubled. But despite what were considered significant differences in the execution of these studies, these calculated DLs are actually fairly close to each other and could be considered equivalent. So the DL for these studies could be the average, or about 5 µgrams/cm2.
Discussion
From the above analyses, comments from the analysts, and observation of the studies, we found there were four main sources of variation in visual inspection: the preparation of the coupons, the analysts, the inspection method, and the type of residue.
The Coupons
In our first study, coupons were spiked manually. Examination of all of the coupons and comments from the analysts indicate there was some obvious variation in the preparation of the coupons. Residues were noticed to be deposited differently, with some having clear thick edges and some exceeding the boundaries of the inscribed areas. Scratches on the coupon surfaces, specks of dust dried onto the coupon, and unevenness of residue deposits also caused questions with some analysts. In the second and third studies, the coupons were spiked using an automated spraying device resulting in a uniform coating of residue. The coupons were also stored in a box to avoid deposition of dust. Preparation, storage, and handling of coupons are important parameters in visual inspection.
The Analysts
The total number of analysts in the first study was 72. Examination of data showed a few results that were not believable. There were a small number of cases where coupons with a reference value of "1" were designated as “9,” and vice versa. The differences between coupon sets 1 and 9 were too dramatic to accept these results as correct. These students would not confirm their results, so this data was discarded. Some analysts had data entry errors (e.g., illegible, gave two answers) and could not be contacted to rectify the entries, so their results were also removed from the study, reducing the analyst population to 68. The analysts were made up of students in the Pharmaceutical Manufacturing Program attending class, and some may not have clearly understood the purpose of the study or taken it as seriously as they should have. Consequently, training is a very important aspect of visual inspection. We found that without training some analysts did not know what to look for or even what a residue looked like which implies that newly hired operators in industry should be trained so as to know what a residue looks like.
The Inspection Method
In the first and second studies, the analysts were instructed to report the best possible match with the standards. Because of this restriction, there was positive bias on the low end and negative bias on the high end. So in the third study that restriction was removed and the protocol was set up in a way that the analyst could report the residues as they saw them.
The Residue
The visualization of residues can be very dependent on the nature and property of residue. For example, some residues may reflect colors, some are crystal in nature and are easier to see, and some may have a lighter or a darker color than the coupon surface. These properties can make visualizing residues of one compound on a surface different from another compound.
Summary
This study demonstrated the VI of stainless steel surfaces for residues to be linear with R2 values greater than 90 percent, fairly accurate but with a positive bias, and not very precise with percent RSDs of around 20 percent at levels greater than the detection limit. The detection limits were found to vary from about 3 µgram/cm2 to about 7 µgram/cm2 based on how the residue was deposited on the surface and how the inspection was performed. So, detection limits found in literature may not be completely depended on. However, from these studies it does appear there may be a fairly narrow range where residues begin to be readily visible which may lie somewhere between 1 and 10 µgram/cm2 depending on the type of residue, the training of the inspectors, and how the inspection is performed.
Based on the results of these studies, we highly recommend a training program for VI in order to increase its reliability. Such training may qualify pharmaceutical operators and quality inspectors to see drug residues down to demonstrated levels for confident release of equipment to production after cleaning. The use by the industry of a "standard panel,” as employed for these studies, does not seem feasible as it is cumbersome for normal inspection use and has potential issues with ongoing storage and maintenance. A subsequent article will discuss how such qualification of VI for operators and inspectors may be more simply accomplished.
With the advent of the ADE/PDE (acceptable daily exposure/permitted daily exposure), the safe levels of residues on equipment surfaces can now be scientifically determined, and many low-hazard products whose MSSRs (maximum safe surface residues) are well above their visual detection limits may become candidates for VI as a sole criterion for validation.
Acknowledgement: The authors wish to thank Paul Battle of Environmental Resource Associates for technical assistance and preparation of coupons for these studies.
Peer reviewers: Thomas Altmann, Mallory DeGennaro, Ioanna-Maria Gerostathi, Mohammad Ovais, Osamu Shirokizawa, and Sarra Boujelben
References:
- PIC/S "Recommendations on Validation Master Plan, Installation And Operational Qualification, Non-Sterile Process Validation, Cleaning Validation,” PI 006-3 25 September 2007
- FDA Guide to Inspections Validation of Cleaning Processes, July 1993, U.S. Food and Drug Administration (FDA)
- International Conference on Harmonisation of Technical Requirements for Registration of Pharmaceuticals for Human Use, ICH Harmonised Tripartite Guideline, Pharmaceutical Development – Q7, November 2000
- World Health Organization Supplementary Guidelines on Good Manufacturing Practices (GMP): Validation
- Jenkins, K.M. and Vanderwielen, A.J. "Cleaning Validation: An Overall Perspective.” Pharmaceutical Technology Vol 18, No. 4, 1194 pp. 60-73
- Frank Buscalferri, Dr. Sabine Lorenzen, Dr. Michael Schmidt, Dr. Hans-Martin Schwarm, Dr. Ehrhard Anhalt, Dr. Reinhard Herzog, and Prof. Ronald Ziegler, "Bestimmung der Sichtbarkeitsgrenzen von pharmazeutischen Feststoffen auf Edelstahloberflächen,” Pharm. Ind. 62, No 6, 2000
- Richard J. Forsyth, Vincent Van Nostrand, and Gregory P. Martin, "Visible-Residue Limit for Cleaning Validation and its Potential Application in Pharmaceutical Research Facility,” Pharmaceutical Technology - Oct 02, 2004
- Richard J. Forsyth and Vincent Van Nostrand, Using Visible Residue Limits for Introducing New Compounds into a Pharmaceutical Research Facility Pharmaceutical Technology - Apr 02, 2005
- Richard J. Forsyth and Vincent Van Nostrand, "Application of Visible-Residue Limit for Cleaning Validation,” Pharmaceutical Technology - Oct 02, 2005
- Vincent Van Nostrand, Richard J. Forsyth, "Application of Visible-Residue Limit for Cleaning Validation,” Pharmaceutical Technology - Oct 02, 2005
- Jeffrey Hartman, Vincent Van Nostrand, Richard J. Forsyth, "Risk-Management Assessment of Visible-Residue Limits in Cleaning Validation" Pharmaceutical Technology - Sep 02, 2006
About The Authors:
Parth Desai, MS, is validation supervisor at Nostrum Laboratories, Inc. and worked as a research assistant on the investigation of visual inspection, development of total organic carbon and conductivity analysis, and the application of design of experiments in cleaning process development in the Stevens Pharmaceutical Research Center at Sevens Institute of Technology.
Andrew Walsh, MS, CLSSBB, is president of the Center for Pharmaceutical Cleaning Innovation, a non-profit research and educational organization that supports pharmaceutical, biologics, nutraceutical, cosmetic, and medical device industries through its research into developing new technologies and training on the implementation of science, risk, and statistics-based approaches to cleaning process development and validation. Andrew was also an industry professor in the Pharmaceutical Manufacturing and Engineering program at Stevens Institute of Technology and founded and directed the Stevens Pharmaceutical Research Center.