
Measuring The Impact Of Recent Regulatory Guidances On Pharma Quality Systems
By Peter Calcott, Ph.D., and Peiyi Ko, Ph.D.

In our previous article, we described a survey we performed to quantitatively measure how well the pharmaceutical and biopharmaceutical industry had embraced the introduction of a number of new regulations and guidances (ICH Q8-Q11, European Medicines Agency and FDA process validation guidances) and their relative value in developing and producing new drugs. In that article, we observed that while these new guidances have been implemented, at least in part, not all the benefits have been accrued by companies. This was evident for quality by design (QbD) as well as quality risk management. We also noted that companies of different sizes responded differently to questions and that the perceptions of quality professionals were often different to those of non-quality professionals.
This article summarizes the second part of the survey, which includes opinions on how well these regulations have impacted operations and looks at the general health of some key quality management system (QMS) elements that are described and proposed in these regulations. Those elements include change control, investigation and CAPA (corrective and preventive action) systems, document management, Big Data and knowledge management (KM), and quality metrics.
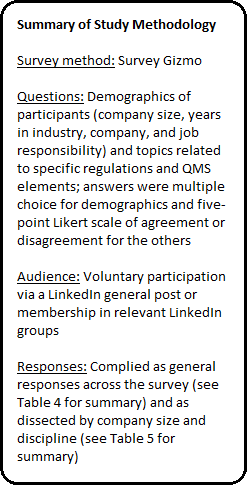 We employed a survey methodology using Survey Gizmo conducted via LinkedIn (see sidebar), as in the first survey. We constructed a series of questions to gather specific information related to these new regulations and guidances and their implementation. As before, we present the data compiled from all respondents as well as the results of dissecting the data along the dimension of company size (less than $500 million and over $500 million in revenue) and discipline of respondents (quality and non-quality functions). Where there is a difference between the groups, it is noted in the text. If no stratification was noted, it is not discussed. In these two groupings we determined the level of significance of the differences using Chi-Square analysis.
The technical questions were designed to probe respondents’ perceptions by posing statements that were both positive and negative. Respondents were asked to rank the statements on a Likert scale including response options of strongly agree, agree, neutral, disagree, and strongly disagree.
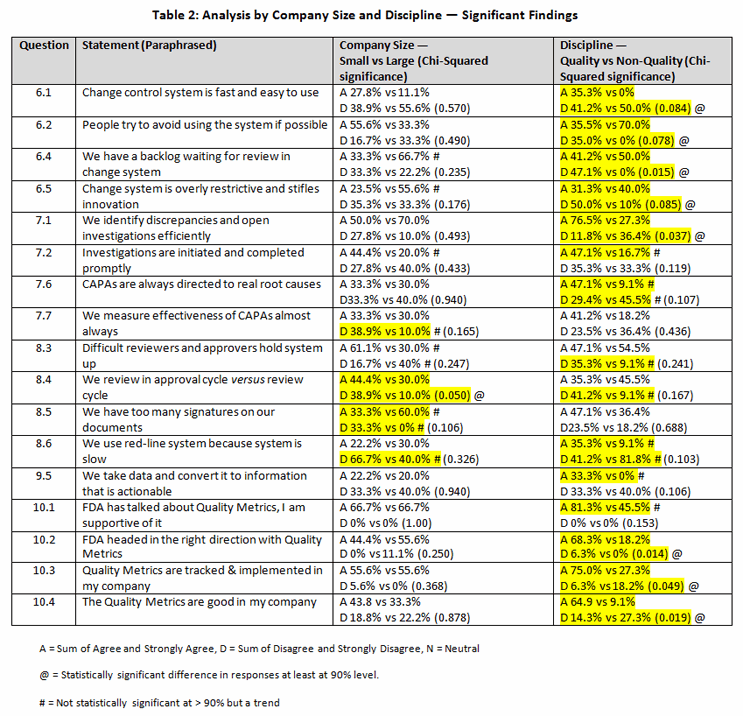
You can review the entire questionnaire via this link. Table 1 contains the raw data for these questions with trends noted. You can also see a breakdown of the questions where different responses were seen for different company sizes and from discipline of responders here. The most significant findings are summarized in Table 2.

Change Control (Question 6)
This key process in a modern quality management system is often problematic in companies as it can be cumbersome and bureaucratic. The questions in this section were designed to quantify people’s views about the use of change controls in their companies.
Less than half (44.4 percent) believed their process is slow or difficult to use, whereas almost a quarter (22.2 percent) felt the opposite (6.1), with small companies scoring their systems more positively than large companies (27.8 percent versus 11.1 percent). Statistically, fewer quality professionals believe this system is slow or difficult to use than non-quality professionals. Almost half of respondents (48.1 percent) believe people avoid using the system (6.2). Interestingly, more people believe it happens in small companies than large ones (55.6 percent versus 33.3 percent). In this case, a statistically significant number of non-quality staff believed this to be true. The good news is that a risk-based approach (tiered system) is used by almost three-quarters (70.4 percent) in both small and large companies (6.3). Almost half (44.4 percent) report a backlog of changes in their system (6.4), with backlogs being more prevalent in big rather than small companies (66.7 percent versus 33.3 percent). However, non-quality professionals were more pessimistic about the backlogs than quality professionals at a highly statistical level (p=0.015). Approximately a third (34.6 percent) believe the system is restrictive and stifles innovation (6.5); an equal number do not. However, restrictiveness is seen more in large companies (55.6 percent versus 23.5 percent for small companies). Again, quality professionals praised the system more often than non-quality staff did at a highly statistical manner (p=0.085). On the negative side, 59.2 percent reported no review was made of change control processes after implementation to determine if they delivered what was promised (6.6). Only 7.4 percent of respondents reported performing a post-mortem.
This confirms that improvement in change control processes is sorely needed. However, it appears that small companies have more nimble systems than large companies.
Deviations and Investigations/CAPA (Question 7)
Another QMS system that is often problematic is managing deviations and other discrepancies and investigating their causes. These questions were designed to quantitatively measure performance of these systems.
Companies appear to be good at quickly identifying deviations (57.2 percent), with large companies scoring higher than small companies (70 percent versus 50 percent) (7.1). However, more optimism (p=0.037) is registered by quality staff than others (76.5 percent versus 27.3 percent). Initiating and completing investigations is less stellar (35.7 percent) (7.2). Almost 35 percent indicated they do not initiate and complete them in a timely fashion. A greater number of respondents from small companies agreed with the statement that investigations are initiated and completed in a timely fashion than did those from large companies (44.4 percent versus 20 percent).
Although 60.7 percent agreed that investigations identify the key causes, 28.6 percent believed they do not get to the root cause (7.3). More respondents from large companies than small companies were optimistic that investigations identified the root cause (72.2 percent versus 40 percent). Nearly a third (29.6 percent) believed investigations are not thorough, whereas a similar number (33.3 percent) believed they are (7.4).
Repeat deviations, often caused by an incomplete or defective investigation, resulting in ineffective CAPAs, are seen as a problem by 53.6 percent of responders (7.5). Less than 20 percent (17.9 percent) reported few repeat observations. Approximately a third of respondents (32.1 percent) believed CAPAs are directed to the right issue, while a similar number (35.7 percent) believed they are not (7.6). Fewer non-quality professionals were confident (9.1 percent versus 47.1 percent) than quality professionals (p=0.109). Only a third (32.1 percent) of respondents indicated that they almost always measure CAPA effectiveness (7.7). No significant differences were seen between small and large companies or staff disciplines.
It seems that while deviations are identified quickly, the investigations are not always timely or thorough. With a less-than-complete investigation, CAPA is not always directed to the right issue, resulting in a failure to correct problems. With less-than-complete effectiveness checks, it is not surprising that problems do not go away. Large companies fare worse than small companies in these characteristics of investigations, which may reflect the lack of agility.
Documentation Systems (Question 8)
These questions were designed to gauge the health of respondents’ documentation systems.
About a third (35.7 percent) believed their system is operating well, while slightly more (46.5 percent) disagreed (8.1). Less than half (42.8 percent) believed their system is swift, responding in days rather than weeks (8.2). However, a sizable number (39.3 percent) disagreed, with 14.3 percent disagreeing strongly.
Half (50 percent) of responders pointed to difficult reviewers and approvers who hold up documents, whereas only 25 percent disagreed (8.3). Small companies appear to have more problems than large ones (61.1 percent versus 30 percent). More than a third (39.3 percent) cited staff reviewing documents in the approval cycle rather than in the review cycle (8.4). Large companies fared better than small companies (p=0.050). Nearly half (42.8 percent) reported too many signatures on documents (8.5) as a possible cause of slowing down the process. This appears to be a large company problem (60 percent versus 33.3 percent). It was almost statistically significant (p=0.106). Over half (57.2 percent) reported that redlining is either absent or used appropriately, while a quarter (25 percent) identified it as a problem (8.6). The difference in opinions between quality and non-quality staff was almost statistically significant at the 90 percent level (p=0.103).
Approximately a third (35.7 percent) believed their documents are not too long or overly complicated, whereas the same number report this as a problem (8.7). It is a problem for companies of all sizes.
By and large, people are relatively satisfied with their systems, although opportunity for improvement is evident, including simplifying documents, removing superfluous signatures, and improving discipline in the review and approval cycles.
Knowledge Management and Big Data (Question 9)
KM was introduced as an enabler in ICH Q10 but not explained in any detail. Similarly, Big Data is a concept to describe our penchant for gathering data with the hope of converting it to information and knowledge. It is prevalent in research and in clinical trials but is also evident in the manufacturing plant, where it interfaces with KM. The concept is to take the mountains of data, convert it to information and knowledge, and make it available for all to use. These questions were designed to probe companies’ understanding of this topic.
Only one in five (21.5 percent) indicated their company has a well-thought-out strategy, a problem seen with all sizes of companies (9.1). In fact, half (50 percent) indicated an absence of a strategy. It gets worse, with 60.6 percent indicating a lack of clear access to this information and only 17.9 percent having adequate access (9.2). Almost two out of three (64.3 percent) believed they cannot access the information they need (9.3). Only 14.3 percent believed they have what they need. Almost half (42.9 percent) agreed that data is gathered but not converted to information or knowledge that is useful (9.4). Just one in five (21.4 percent) believed we do a good job of creating information or knowledge that is actionable (9.5). The difference of opinion along disciplines was almost significant at the 90 percent level (p=0.106), with a third of quality professionals believing the systems work versus none of non-quality professionals.
The good news is that almost half (42.8 percent) believed there is value in KM and Big Data, yet almost 40 percent (39.3 percent) are not sure (9.6), with 18 percent considering it a hoax. Over 40 percent appeared to understand the concepts (42.9 percent) but do not know where to start (9.7). Only a quarter (28.6 percent) feel that they are confident in knowing what to do. No stratification is seen based on company size, so the conclusions appear to be an industry problem equally shared.
The concepts appear to have value, with support at the grass roots level, but have not been widely acted upon. With leadership, knowledge management has the potential for traction, but many do not know where to start.
Quality metrics (Questions 10)
The FDA is in the early stages of developing quality metrics for the industry. So far all conversations appear to be very rudimentary. These questions are intended to probe understanding and support.
There were no detractors to this agency initiative. In fact, two-thirds (66.7 percent) are in favor, with over a third sitting on the fence (10.1): a significant number are thus not prepared to commit support. But is the FDA going in the right direction? Almost half believe it is (48.1 percent), whereas more than half are skeptical or believe it is not (10.2). But quality professionals are more convinced (68.3 percent versus 18.2 percent) than non-quality professionals (p=0.014). This support may be because most companies use these types of metrics already (55.6 percent) (10.3). Quality professionals are more confident in the metrics (75 percent versus 27.3 percent) than non-quality professionals are (p=0.049).
Are these metrics helpful? A less resounding endorsement is evident (40 percent), with one in five finding them not useful (10.4). However, the initiative fares better in small companies than large (43.8 percent versus 33.3 percent). And whereas 64.9 percent of quality staff approve, only 9.1 percent of non-quality professionals are convinced (p=0.019). Using the deviation system numeric metric to reward people is viewed negatively by many (62.9 percent), presumably because it will drive them underground (10.5). On the other hand, using a right first time metric has support from 63.7 percent, with numerically more support in small companies (10.6). A surprisingly favorable rating was given to the timing of closure metric (61.5 percent) (10.7), although a write-in comment by a respondent and our personal observations demonstrate the desire to move it (to meet the goal) can overtake the desire to get it right. Clearly, getting it done is important, but getting it done right is more important.
Discussion
Observations made anecdotally by the authors have been confirmed in this quantitative survey. Certain QMS elements are problematic and remain so even after many regulation changes that clearly guide the industry toward a culture of science-driven approaches in development as well as operation of the QMS. In spite of this, the three main elements of the QMS are still not operating well and thus offer opportunities for improvement.
In many companies, the change control, investigation/CAPA, and documentation systems are cumbersome and not efficient. They are characterized by slowness, lack of agility, and in the case of the investigations/CAPA system, a lack of effectiveness at getting to the root cause of the problem and fixing it.
Many attempts by companies to impose restrictions on the operators of the system, such as requiring closure in prescribed time frames, often backfire, resulting in operators more interested in moving the documentation along to the next party so they can meet their time metric, rather than getting it right. However, a metric more linked to getting it right might end in a result that the company wants (and needs). That would require analyzing the problem fully and clearly identifying the root cause, resulting in implementing an effective CAPA. The lesson is to watch what you measure and assure it drives the right behavior.
A disconcerting finding was that for both change control and investigation/CAPA systems, effectiveness checks were not universally performed. In the case of change control, changes are most often proposed for the better based on good science or logic. But, unless you determine after implementation that a change delivered what was promised, there is no way to question the validity of the science or logic of the decision-making process. This review cycle is a critical element in the implementation of continuous improvement as espoused in ICH Q10 using the tools of ICH Q9. It is not surprising that people find ways to avoid using these systems. Similarly, an effectiveness check after an investigation/CAPA cycle is critical to confirm validity and effectiveness of the actions.
Documentation systems can be responsive or a drudgery to navigate, depending on the system and the people running it. It is disconcerting to see in the responses a significant number of people reporting that their systems are slow, require too many signatures, and include people who do not follow the procedures, e.g., reviewing during the approval cycle. Clearly this is another system in need of improvement.
The concept of knowledge management is at least known in the industry, although it seems that many people are not sure how to start implementing it. When phrased in the context of “do you have access to all the information you need?”, it is evident that silos are alive and well in many companies, with a lack of access to information and/or a lack of clear systems in place to develop knowledge from data, which then leads to actions for the better. Only after a more open culture is in place will the benefits of KM blossom. The beauty of KM is that it is powerful when implemented. We have seen it implemented in at least one of our clients, but it required a culture shift and trust across all departments.
The FDA’s push for quality metrics is a relatively new endeavor. It is still a voluntary process, focusing on three metrics (success rate in the plant, complaint rates, and invalidated out-of-specification rates). While these metrics may be useful, I believe there are a lot more equally valuable metrics, but to get everybody to agree on them would be a monumental task. We envision industry adopting the “required metrics” as espoused by the FDA but also running other metrics that may be equally if not more valuable internally
When we examine the breakdown by company size and job categorization, interesting findings can be seen. We were expecting stratification based on company size, but very few points showed disparity on that basis.
The predominant area where company size played a significant role was in the questions related to documentation systems. Large companies appeared to have slower, more rigid, and less flexible systems than smaller companies. There was surprising similarity in all the other topics.
The interesting finding was that which showed that quality professionals were more optimistic and positive about the systems and trends than non-quality staff. It could be because the quality staff are often the group that develops and manages these systems, whereas non-quality staff are the users (but not owners) and may have less vested in the systems. Alternatively, it might reflect a poor rollout of the system or a lack of engagement in the development and implementation. We have found that the most well-adopted systems entail creating ownership across the organization by engaging users as well as owners in the user requirements and design phases.
Many of the anecdotal trends we have seen were confirmed in this survey, and, as predicted, there are many opportunities for improvement across the industry in the QMS system.
About The Authors:
 Peter H. Calcott, Ph.D., is president and CEO of Calcott Consulting LLC, which is focused on delivering solutions to pharmaceutical and biotechnology companies in the areas of corporate strategy, supply chain, quality, clinical development, regulatory affairs, corporate compliance, and enterprise e-solutions. He is also an academic program developer for the University of California, Berkeley in biotechnology and pharmaceutics postgraduate programs. Previously, he was executive VP at PDL BioPharma, where he was responsible for development and implementation of quality and compliance strategy across the corporation. He has held numerous positions in quality and compliance, research and development, regulatory affairs, process development, and manufacturing at pharmaceutical companies including Chiron, Immunex, SmithKline Beecham, and Bayer. He has successfully licensed products in the biologics, drugs, and device sectors on all six continents. Dr. Calcott holds a doctorate in microbial physiology and biochemistry from the University of Sussex in England. You can reach him at peterc@calcott-consulting.com.
 Peiyi Ko, Ph.D., founder of KoCreation Design, creates opportunities for positive changes and innovation through human-system interaction research and human-centered design. She has guest lectured at universities and led workshops. She is also a Certified Professional Ergonomist and collaborates with the Interdisciplinary Center for Healthy Workplaces at UC Berkeley as a consulting expert. She has provided human factors/ergonomics consulting as well as software usability analyses and design recommendations for operational improvements at the Lawrence Berkeley National Laboratory and at BSI EHS Services and Solutions. She obtained her Ph.D. from UC Berkeley in 2012 with additional training from two interdisciplinary certificate programs there: Engineering, Business & Sustainability and Management of Technology.