
Measuring Risk In Cleaning: Cleaning FMEAs And The Cleaning Risk Dashboard
By Andrew Walsh; Thomas Altmann; Alfredo Canhoto, Ph.D.; Ester Lovsin Barle, Ph.D.; David G. Dolan, Ph.D.; Andreas Flueckiger, M.D.; Igor Gorsky; Jessica Graham, Ph.D.; Robert Kowal; Mariann Neverovitch; Mohammad Ovais; Osamu Shirokizawa; and Kelly Waldron, Ph.D.
 Part of the Cleaning Validation for the 21st Century Series
This article discusses the concept and measurement of risk as it applies to the cleaning of pharmaceutical products. Four previous articles discussed how science-based data-derived scales could be created using compound HBELs (health-based exposure limits), from the process capability (Cpu) of the products’ cleaning processes and from the detection limits for visual inspection or for total organic carbon (TOC) analyses of these compounds.1-4 This article continues the discussion about the potential use and application of these new scales in cleaning failure modes and affects analysis (cleaning FMEA) to assist in measuring the risk of cleaning process failures as well as how these scales can be applied to develop a cleaning risk dashboard. The article will also discuss how these new scales can be utilized to accelerate new product introductions.
Note: This article uses the term health-based exposure limit (HBEL), which is synonymous with the terms acceptable daily exposure (ADE) and permitted daily exposure (PDE).
What Is Risk And Why Is Measuring It Important In Cleaning?
Most people will tell you they know what risk is, and they can give clear examples of risks in their lives. But if asked, they will not know, or will have difficulty identifying, what the underlying components of risk are. This is probably because most people have come to understand risk through personal experience and not through any formal study of risk or its measure. Historically, risk has not been very well understood or evaluated properly.5 For example, many people consider all snakes to be dangerous and a risk although only some snakes are actually poisonous and many are harmless and even beneficial. Similarly, while some drugs may be hazardous, that does not mean all of them should be considered a high risk. While risk management has been in use in various industries for many years, it has been seriously misconstrued.6, 7 These problems also apply to the consistency of hazard classification and risk assessment of chemicals.8
In 2005, risk was defined for the pharmaceutical industry in the International Council on Harmonization Quality Risk Management Guideline (ICH Q9), which was formally adopted by the FDA in 2006.9 As stated in ICH Q9:
"It is commonly understood that risk is defined as the combination of the probability of occurrence of harm and the severity of that harm."
and further on:
"The ability to detect the harm (detectability) also factors in the estimation of risk."
In ICH Q9 we see risk deconstructed into two subparts: severity and probability, and a third element of possible prevention, detectability. If we could measure these two (or three) subparts as they apply to the cleaning of healthcare products, we could then determine what the level of risk is for cleaning validation and ultimately for a cleaning process. Why would measuring risk be important for cleaning validation? Most importantly because of a regulatory concern of ICH Q9 asserting that the two primary principles of quality risk management are:
- "The evaluation of the risk to quality should be based on scientific knowledge and ultimately link to the protection of the patient; and
- The level of effort, formality, and documentation of the quality risk management process should be commensurate with the level of risk."
From these two primary principles it can be understood that if we can determine the level of risk to a patient from cleaning, then the level of cleaning validation effort, its formality, and its documentation can be adjusted based on that risk. More simply, cleaning validation for low-risk situations should not require the same level of effort as for high-risk situations. This is quite logical. The level of effort, formality, and documentation of cleaning validation should be scaled to the level of risk, as well as the available knowledge of a cleaning process. ICH Q9 clearly states that these principles are applicable to validation (in Annex II.6). Moreover, they apply to cleaning, including setting acceptance limits for cleaning processes (in Annex II.4). So, cleaning validation efforts, formality, and documentation should be adjusted based on the level of risk(s) identified in a risk assessment (RA) and managed through a quality risk management system.
While that may be good news, an article in 2015 by Kevin O'Donnell of the Health Products Regulatory Authority asserted that the implementation of quality risk management in the pharmaceutical industry may have been riddled with misunderstandings.10 One of the issues with risk management he identified was a lack of sound scientific principles being used in that the "probability of occurrence estimates are not based on any kind of historical data, preventative controls, or on modeling data," and that there have been "assumptions regarding risk severity and detection that are totally unsound." Another issue was making "important decisions based on Risk Priority Number (RPN) values which fail to recognize that those values are derived only from ordinal scale numbers" and "are not mathematically meaningful" and that these RPNs are often "associated with high levels of subjectivity, uncertainty and guesswork."10 Other recent articles have explored the weaknesses of the use of risk matrices to derive RPNs.11-18
Clearly, it would be very helpful if the pharmaceutical industry had the means to measure these elements of risk based on sound scientific principles. The scales presented in the first four articles1-4 offer science-based answers to these issues – specifically with regard to cleaning – that can be readily utilized in meaningful, measurable, and practical risk-based approaches.
Going back to ICH Q9, we see risk can be formally expressed as:
Risk = f (Severity of Hazard, Level of Exposure to Hazard, Detectability of Hazard)
Now, if the hazard is intrinsic to an active pharmaceutical ingredient (API) and the risk being considered is harm to a patient from exposure to residues of that API after cleaning, then this equation can be further refined to:
Cleaning Risk = f (ToxicityAPI residue, Level of ExposureAPI residue, DetectabilityAPI residue)
Since the scales presented in the previous four articles are all based on good science and derived from actual data, they would consequently make good choices to use for evaluating the risk in cleaning.
Measuring Cleaning Risk: Cleaning FMEAs
One of the most commonly used tools for risk assessment, widely used in the pharmaceutical industry, is the FMEA. The FMEA is considered a systematic, comprehensive, and powerful tool for performing risk management and has also been adapted for the evaluation of processes, so it fits well into the assessment of cleaning processes. The FMEA was developed by the U.S. military shortly after World War II and published as MIL-P-1629.19 It was adopted for use by NASA and the aviation industry in the early 1960s, then in the 1970s by the automotive industry. It was adopted later by many other industries, eventually making its way into international standards such as ASTM and ISO, but only in recent years has it been implemented in the pharmaceutical industry.
FMEAs typically use three criteria in their evaluation of failure modes or hazards that fit well in the ICH Q9 definition of risk:
- Severity (of the hazard)
- Occurrence (probability of the hazard)
- Detectability (of the hazard)
Once a failure mode is identified, the severity of the effect of the failure, the likelihood of its occurrence, and the ability to detect this failure are then determined. In the FMEA, these three criteria are normally evaluated using ordinal scales that can range from 1-10, 1-5, 1-3 (Low/Medium/High), or other combinations, with 1 being the lowest score and 3, 5, or 10 being the highest. Table 1 shows some general rating scores used in FMEAs.20
Table 1: General Rating Scales for FMEA20
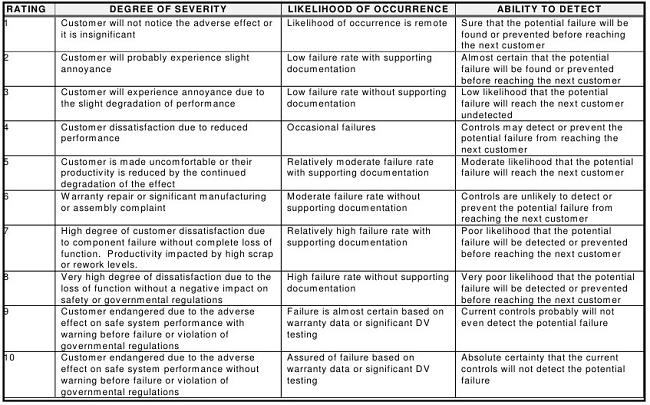
After the values are selected from the three categories, they are subsequently multiplied to arrive at an RPN, which is typically used to rank failures and prioritize them for any needed actions (e.g., when the identified number is above a specified RPN, remedial actions must be taken, and when the number is below a specified RPN, no remedial actions are required). For scales that use 1-10 scoring, the possible range of RPNs is therefore from 1 to 1,000 (S*O*D). So, for example, if the Severity Score = 5, the Probability Score = 9, and the Detectability Score = 8, the resulting RPN would be 360.
A review of the descriptions and definitions in Table 1 will quickly reveal that these factors do not directly translate to many pharmaceutical operations. The consequences of manufacturing failures affecting pharmaceutical products, such as a cleaning failure, are substantially different from the failures that might affect other unrelated industries. There is therefore a need for pharmaceutical companies to establish more appropriate definitions and descriptions for each of these values within their organizations that are truly reflective of the realities of their operations. Compounding this challenge are issues with different stakeholders, such as QA, technical services, and operations, having widely different opinions on what is a correct score, since most definitions are general, subjective, and debatable.
Beyond these difficulties and the issues mentioned above,11-18 there are other issues with the traditional FMEA approach that have been identified and described by Donald J. Wheeler.21 In his article, Wheeler points out that while the possible RPNs range from 1 to 1,000, an actual calculation of these RPNs results in a very skewed distribution of only 120 possible actual results (Figure 1).

Figure 1: Distribution of RPN results (used with permission of the author)
Wheeler goes on to show that there are no fewer than 15 combinations that could result in an RPN of 360, some of which could be considered critical and others, perhaps, not so much. So the RPN numbers derived using these subjective scales have the potential to be very misleading (Figure 2).

Figure 2: Fifteen "equivalent" problems having an RPN = 360 (used with permission of the author)
Wheeler further explains that the ordinal scales typically used in FMEAs cannot be multiplied legitimately. Looking at the definitions of the scores in Table 1 and the example results in Figure 2, it quickly becomes obvious that the RPN values from their multiplication have no particular or practical meaning.
Wheeler goes on to suggest that instead of multiplying them, these scores should remain as they are and the severity (S), occurrence (O), and detectability (D) scores could simply be expressed as a numerical string -- SOD. For example, SOD = 937, or SOD = 396. This approach would maintain the integrity of the original scores, which could allow for more appropriate ordering. This also enables a reviewer to see where quantitative improvements were made after any recommended actions were taken. For example, if a failure mode had an SOD of 978, and the new score was 965, it would be clear that a small decrease was made in the occurrence and a greater improvement made in the detectability. However, when the scores are converted to RPN values, they would be 504 and 270, which would seem to be a significant overall improvement, while in reality there only was a small improvement. Therefore, the magnitude of calculated numbers is very misleading and the actual “how it happened” is unclear.
Science- And Risk-Based Scales For Severity, Occurrence, And Detectability
The subjectivity of the FMEA scales typically used, and the lack of a scientific/statistical basis for their RPN numbers, make both these scales and their RPNs unacceptable for use in the pharmaceutical industry. If pharmaceutical manufacturing is to advance to a science- and risk-based approach, the scales for severity, occurrence, and detectability used in FMEAs must be scientifically justified using scientific principles, process knowledge, and statistics. These scales should be derived from, and based on, empirical data. Such data exists for cleaning and is readily available in pharmaceutical manufacturing production. As stated in the introduction, scales already exist that can be used for the following criteria:
- HBEL-derived Toxicity Scale for Severity of Process Residues1
- Cpu-derived Scale for Occurrence of Exposure to Process Residues2
- Visual Detectability Index for Detectability of Process Residues 3
- TOC Detectability Index for Detectability of Process Residues 4
For example in a cleaning process, if a failure mode could result in residues of an API remaining on equipment, then the HBEL-derived toxicity score of that API would replace the severity score. Furthermore, if the process capability of the cleaning process is known, then its Cpu-derived score could replace the occurrence score (as the cleaning process effectiveness and the probability of residues are known). Finally, if either the visual detectability index3 or the TOC detectability index4 is known, one or both of these could replace the detectability score. Since these scores are derived directly from empirical data, their values are specific, objective, and nondebatable.
For a refresher on these scales, please see the following articles:
- An ADE-Derived Scale For Assessing Product Cross-Contamination Risk In Shared Facilities
- A Process Capability-Derived Scale For Assessing The Risk Of Compound Carryover In Shared Facilities
- An MSSR-Derived Scale For Assessing Detectability Of Visual Inspection
- A Swab Limit-Derived Scale For Assessing The Detectability Of Total Organic Carbon Analysis
Using The Detectability Scales For Method Selection
In the previous articles on detectability scales,3, 4 it was suggested that the selection of the analytical methods used in cleaning validation studies should be based on the level of risk. These articles showed a diagram (Figure 3) that linked the selection of analytical methods to the toxicity scores of compounds. Compounds of low toxicity (lower risk) might only use visual inspection, while compounds of high toxicity (higher risk) might require advanced selective methods. However, when to transition from one group of methods to another is unclear from this figure, and these articles presented detectability scales for visual inspection and TOC that could guide the selection process based on actual data.

Figure 3: Risk hierarchy of analytical methods [Note: Toxicity scale is based on –log(HBEL) where HBEL is the health-based exposure limit in grams]
Table 2 shows how detectability scores derived using the calculations from the detectability articles3, 4 could be used to determine the most advisable risk-based approach for 10 drugs.
Table 2: Method Selection Based on Detectability Scores

Note: In all cases a visual inspection will still be done.
For the 10 drugs in Table 2, the hypothetical criteria used for selecting a TOC method was at least 1 log below zero and for using visual inspection was at least 2 logs below zero. (Note: Companies will need to select their own criteria based on their level of risk acceptance.) So for Drugs 2, 3, and 8, selective methods are necessary as they are well above zero. For Drugs 5 and 9, TOC is acceptable, but visual inspection is not, and for Drugs 4 and 7, both TOC and visual inspection are acceptable. Visual inspection alone would be acceptable for Drugs 1, 6, and 10, as they are well below -2 logs.
Using The Toxicity And Cpu Scales To Measure Cleaning Risk
As both the HBEL-based toxicity scale for severity of hazard and the Cpu-based process capability scale for probability of exposure (occurrence) are not arbitrary values, they consequently have real significance. The toxicity and probability of exposure may be evaluated first, and then detectability can be considered for prioritization when the toxicity and probability of exposure of two hazards are equal. Table 3 shows the toxicity and process capability scales side by side from the highest to the lowest possible values.
Table 3: Calculating Cleaning Risk Using the Toxicity and Cpu Scales

In the article on Cpu-based process capability scale,2 a table was shown (Table 4) asking the reader to select the risk ranking for 10 hypothetical drugs based on these SO scores.
Table 4: Example Drug Scores and RPNs in Shared Equipment Facilities

The following considerations are proposed to answer the question in that article:
- Drug 1 and Drug 2 have the same RPN scores, but the cleaning procedure for Drug 1 needs considerable improvement to assure that any residues after cleaning are at safe levels, while Drug 2 does not. However, the traditional RPNs assign them an equal level of risk.
- The traditional RPN method puts Drug 9 as the highest risk (RPN = 48), but it is not highly toxic, although its cleaning process is not very effective. Based on its high RPN, it is followed by Drug 5, which is highly toxic, although its cleaning process is very effective.
- Conversely, Drug 6, with a low toxicity, has a very poor cleaning process that is assured to leave residues, but it has the second lowest RPN score.
It should be evident that multiplying these scores obscures the important information found in the individual scores. More importantly, it can lead to poor risk analysis and decisions. So, keeping the raw scores is appropriate. The remaining question is how the risk is objectively analyzed. One possible way is to give priority to the toxicity scores. Table 5 shows the same data as Table 4 sorted from the highest toxicity score to the lowest.
Table 5: Ranking Level of Risk by Toxicity Score

- Now we see that Drug 5 is ranked as the highest risk, as it has the highest toxicity score, but its cleaning procedure is very effective and the risk of patient exposure to residues is very low.
- Drug 2 has the next highest toxicity score, but its cleaning procedure is more effective than Drug 5 (refer to Table 4) and the risk of patient exposure to residues is even lower.
- Drug 9 has a moderate toxicity score, but the cleaning procedure is much worse than both Drugs 5 and 2 and has a high probability of leaving residues leading to cross contamination and patient exposure.
- Drugs 1 and 6 present low hazards, but their cleaning procedures will definitely leave residues leading to cross contamination and therefore have high risks for patient exposure. It becomes apparent that simply ranking compounds by their toxicity scores is not a suitable way to measure cleaning risk.
Table 6: Ranking Level of Risk by Cpu Score

Table 6 shows the same data as Table 5 but sorted from the highest process capability (Cpu) score to the lowest.
- Now we see that Drug 6 is the highest risk since it has the worst probability score due to poor cleaning process capability and will leave residues. Although Drug 6 is not very hazardous, it clearly poses the highest risk for cross contamination.
- Drug 1 has the next highest cleaning process capability score. Although Drug 1 is slightly more hazardous than Drug 6, its cleaning procedure is more capable of reducing residues than Drug 6. This example shows that while Drug 1 is not very hazardous, it poses a high risk for cross contamination due to poor process cleaning.
- Drug 9 is next as its cleaning procedure is not very good and, although Drug 9 has a moderate toxicity score and is likely to leave residues and pose a high risk for cross contamination, the probability of residues is lower than for Drugs 6 or 1.
These drugs are now ordered from 10 to 1 based on their risk of cross contamination. It appears that ranking by cleaning process capability followed by toxicity is a promising approach to risk management in cleaning. Detectability scores for visual inspection and TOC can be added into the analysis for more refinement of the level of risk.
But what of the ICH Q9 promise of the quality risk management process being commensurate with the level of risk? Can these Cpu and toxicity scores be used for managing cleaning programs and developing a control strategy based on the risk? Table 7 shows a proposed high-level evaluation of the 10 drugs in the above example that may be classified into different risk levels based on these scores. (Note: The reader should understand that the toxicity and Cpu scales are continuous scales and can have intermediate values [e.g., 6.3, 4.7, etc.], so these classifications are for example only and should not be considered definitive in any way.)
Table 7: Example Risk Evaluation Based on Cpu Score and Toxicity Score
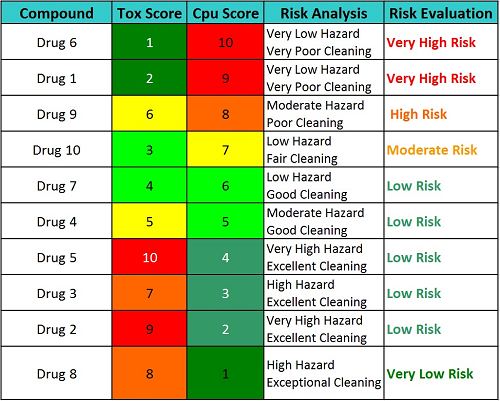
Based on the example evaluations shown in Table 7, an action plan for each drug could be put in place to reduce risk or to mitigate the unacceptable risks or, if the risk is determined to be acceptable, to develop a control plan to maintain that acceptable level of risk.
Table 8: Possible Action Plans Based on the Level of Risk
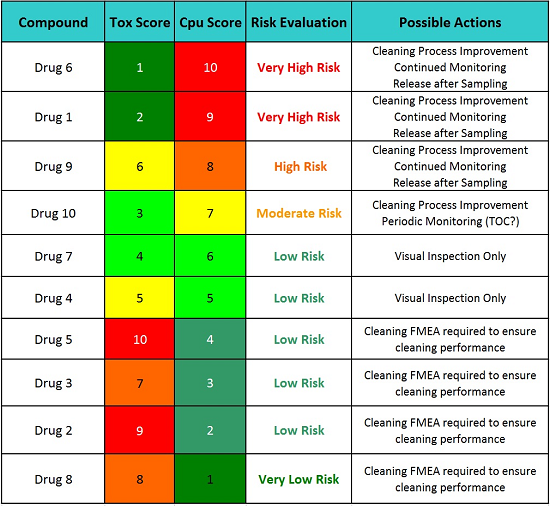
Table 8 indicates that the cleaning procedures (SOPs) for Drugs 5, 3, 2, and 8 require a formal cleaning FMEA to ensure the continued cleaning performance for these drugs. While these drugs have excellent and highly effective cleaning procedures, a failure in one of the steps in these cleaning procedures could have catastrophic consequences since their hazard levels are so high. So, for these drugs, performing formal cleaning FMEAs as part of a continued quality risk management program and identifying possible failure modes and proactively implementing corrective actions, such as error-proofing (e.g., poka-yoke), improving cleaning procedures and methods, etc., are the most appropriate actions before any possible failure has a chance to take place. For example, the Viracept situation may not have happened if a formal cleaning FMEA had been performed before that incident occurred.22 However, the cleaning procedures for the other six drugs should also have formal cleaning FMEAs, but not until after any recommended cleaning process improvement activities are completed. Since many drugs share a common cleaning procedure, their formal cleaning FMEAs could be combined into one exercise.
Table 9 shows an example formal cleaning FMEA using the scales in this article. In this hypothetical, a number of basic possible cleaning failures are listed, such as "cleaning solution concentration too low." While the listed product has a toxicity score of 7.7, the cleaning process is very effective and residues can be easily detected visually and by TOC. This detectability should be included in the risk analysis of these failures and then become part of the control strategy. However, the cleaning process capability shown may not always be the same if the cleaning agent solution is not made correctly. Similar concerns can arise about the cleaning agent contact time not being long enough or the temperature being too low. How should this be addressed? Such questions can be answered using data from design of experiments combined with Monte Carlo analysis and will be discussed in the next article.
Table 9: Hypothetical Example of a Formal Cleaning FMEA

The Cleaning Risk Dashboard
Dashboards are widely used in business to provide simple "at-a-glance" tools that can quickly show visual representations of complex relationships among many business metrics, key performance indicators (KPIs), or any other data important to making decisions about a business process. Dashboards communicate knowledge efficiently and simplify the decision-making process in business and other endeavors by making multiple sources of data and their relationships easy to visualize. Ultimately, a critically important process such as QRM would benefit from a dashboard that could easily present the multiple sources of data so decisions concerning risk can be made efficiently and with confidence.
The scales discussed in this article and in the previous four articles can be used to develop such a dashboard. Figure 4 shows an example of how new compounds can be quickly and easily evaluated to determine whether the current cleaning process and analytical methods allow these compounds to be manufactured in a shared equipment facility. Their HBELs are determined and evaluated against the facility's existing cleaning data that compares its cleaning process capability against the known detection limits to determine if the existing methods are capable of detecting these new compounds.

Figure 4: Examples of using the cleaning risk dashboard
Note: Excel spreadsheets for creating these scales can be downloaded for free:
- Spreadsheet to Create a Toxicity Scale from HBELs
- Spreadsheet to Create a Process Capability Scale from Cpu Data
- Spreadsheet to Create Detectability Scales from TOC and Visual Inspection Detection Limits
Immediately, it can be seen that Drug 1 is a very toxic compound and that the current cleaning process cannot adequately clean it to prevent cross contamination issues. (Note: Process capability can be evaluated based on existing cleaning data compared to the limits required by the new compound). In addition, residues cannot be detected at a safe level, visually or even by TOC. Introducing this drug would require substantial improvements in both the cleaning process and analytical methodologies. Most likely, a manufacturer would need to dedicate equipment or an entire facility to the manufacture of this drug.
Drug 2, on the other hand, is not highly toxic, and the current cleaning process can easily clean it to prevent cross contamination issues and any residues can be easily detected visually or by TOC. Introducing this drug would not require any improvements and would potentially require evaluation of initial manufacturing by visual inspection only.
Drug 3 is somewhat toxic, but the current cleaning process could adequately clean it to prevent cross contamination issues, and while residues cannot be detected visually, the TOC method is acceptable for detection. Introducing this drug would also not require any improvements.
There are other issues to consider in introducing a new product; however, this dashboard provides an effective screening tool for making decisions on whether cleaning process development is needed, what analytical methods can be used, and if analytical method development is needed to justify the introduction of new products. Such a dashboard also provides an easy, high-level view of manufacturing operations for rapid measurement of risk in a facility, department, or manufacturing line.
Conclusion
One of the stated goals of the ASTM E3106-17 Standard Guide for Science and Risk Based Cleaning Process Development and Validation was to provide a framework for a scientific risk- and statistics-based approach to cleaning processes and validation based on ICH Q9 and the FDA's 2011 Process Validation Guidance. Again, the benefit of such an approach would be the ability to scale the level of effort, formality, and documentation of the cleaning validation process commensurate with the level of risk, while providing a visual tool for communicating these risks. Objective tools to measure risk in cleaning can focus cleaning validation efforts where the risks are the greatest based on: the science behind the HBEL score, which informs us which products are the most hazardous; the Cpu score of the cleaning process, informing us what the probability of residues are; and, as we saw in Table 2, the detectability scores, which can determine the appropriateness of analytical methods and guide their selection.
Table 10 offers an example of how the toxicity score and the Cpu score could be used to make decisions on whether additional cleaning process development is necessary, whether continued or periodic monitoring or simple visual inspection may be appropriate, and even when product dedication may be necessary.
Table 10: Example of Possible Actions Based on Toxicity and Cpu Scores
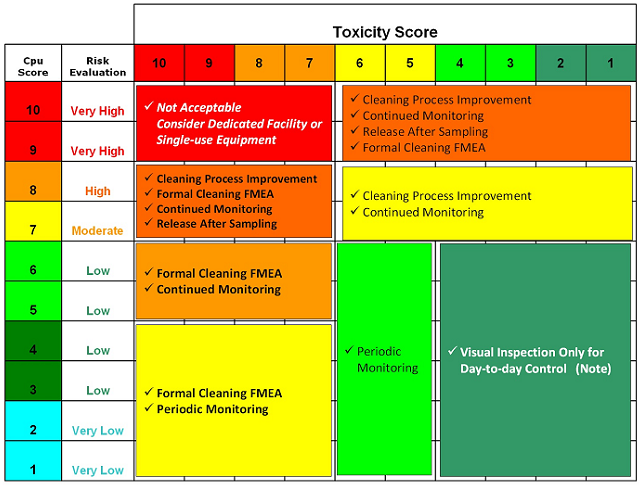
Note: For all cases, a visual inspection must still be done.
Table 10 offers a road map for a decision-making process for selecting cleaning validation activities and developing an ongoing control strategy based on data. However, this is just an example of how choices could be decided, and each company would need to decide how to implement this. In his book “Against the Gods: The Remarkable Story of Risk,” Peter Bernstein5 notes that:
"The essence of risk management lies in maximizing the areas where we have some control over the outcome while minimizing the areas where we have no control over the outcome and the linkage between effect and cause is hidden from us."
We can maximize the cleaning process capability to reduce residues to the lowest practical levels while focusing on those parameters that lower our detection limits. Since the toxicity of APIs is intrinsic and cannot be influenced, we can minimize the likelihood for toxic compounds to cross contaminate other products. But this is only possible if we truly understand where the risks are. The recent requirement for all companies to determine HBELs for their compounds23 provided a data-based measure of a compound's toxicity for determining cleaning limits and set the stage for the measurement of risk in cleaning based on scientific principles. In this article we have presented science- and data-based visual tools to advance the scientific rigor in the cleaning of healthcare products, such as pharmaceuticals, biopharmaceuticals, cosmetics, and medical devices.
Peer Review:
The authors wish to thank our peer reviewers Bharat Agrawal; James Bergum, Ph.D.; Sarra Boujelben; Gabriela Cruz, Ph.D.; Mallory DeGennaro; Kenneth Farrugia; Ioanna-Maria Gerostathi; Miquel Romero Obon; Laurence O'Leary; Joel Young; Ersa Yuliza; and Mark Zammit for reviewing this article and for their many insightful comments and helpful suggestions.
References:
- Walsh, Andrew, Ester Lovsin Barle, Michel Crevoisier, David G. Dolan, Andreas Flueckiger, Mohammad Ovais, Osamu Shirokizawa, and Kelly Waldron. "An ADE-Derived Scale For Assessing Product Cross-Contamination Risk In Shared Facilities" Pharmaceutical Online, May 2017
- Walsh, Andrew, Ester Lovsin Barle, David G. Dolan, Andreas Flueckiger, Igor Gorsky, Robert Kowal, Mohammad Ovais, Osamu Shirokizawa, and Kelly Waldron. "A Process Capability-Derived Scale For Assessing Product Cross-Contamination Risk In Shared Facilities" Pharmaceutical Online August 2017
- Walsh, Andrew, Thomas Altmann, Alfredo Canhoto, Ester Lovsin Barle, David G. Dolan, Mariann Neverovitch, Mohammad Ovais, Osamu Shirokizawa and Kelly Waldron. "An MSSR-derived Scale for Assessing the Detectability of Compound-Carryover in Shared Facilities" Pharmaceutical Online December 2017.
- Walsh, Andrew, Thomas Altmann, Alfredo Canhoto, Ester Lovsin Barle, David G. Dolan, Andreas Flueckiger, M.D., Igor Gorsky, Robert Kowal, Mariann Neverovitch, Mohammad Ovais, Osamu Shirokizawa and Kelly Waldron. "A Swab Limit-Derived Scale For Assessing The Detectability Of Total Organic Carbon Analysis" Pharmaceutical Online January 2018
- Bernstein, Peter L., "Against the Gods: The Remarkable Story of Risk" John Wiley & Sons, Inc. 1998.
- Hubbard, Douglas W. "The Failure of Risk Management: Why It's Broken and How to Fix It" Wiley; 2009, 1 edition
- Taleb, Nassim Nicholas "Fooled by Randomness: The Hidden Role of Chance in Life and in the Markets" Random House 2008
- Hansson Sven Ove and Christina Rud´en "Evaluating the risk decision process" Toxicology 218 (2006) 100–111
- International Conference on Harmonization of Technical Requirements for Registration of Pharmaceuticals for Human Use, ICH Harmonized Tripartite Guideline, Quality Risk Management – Q9, Step 4, 9 November 2005, http://www.ich.org/fileadmin/Public_Web_Site/ICH_Products/Guidelines/Quality/Q9/Step4/Q9_Guideline.pdf.
- O'Donnell, Kevin "QRM in the GMP Environment: Ten Years On — Are Medicines Any Safer Now A Regulators Perspective" Journal of Validation Technology December 21, 2015.
- Ball, D. J., & Watt, J. (2013). Further thoughts on the utility of risk matrices. Risk Anal, 33(11), 2068-2078.
- Baybutt, P. (2014). Allocation of risk tolerance criteria. Process Safety Progress, 33(3), 227-230.
- Baybutt, P. (2016). Designing risk matrices to avoid risk ranking reversal errors. Process Safety Progress, 35(1), 41-46.
- Cox, L. A., Jr. (2008). What's wrong with risk matrices? Risk Anal, 28(2), 497-512.
- Cox, L. A., Jr., Babayev, D., & Huber, W. (2005). Some limitations of qualitative risk rating systems. Risk Anal, 25(3), 651-662.
- Levine, E. S. (2012). Improving risk matrices: the advantages of logarithmically scaled axes. Journal of Risk Research, 15(2), 209-222.
- Li, J., Bao, C., & Wu, D. (2018). How to Design Rating Schemes of Risk Matrices: A Sequential Updating Approach. Risk Anal, 38(1), 99-117.
- Waldron, Kelly ,"Risk Analysis and Ordinal Risk Rating Scales—A Closer Look" Journal of Validation Technology December 21, 2015.
- MIL-STD-1629A - Procedures for Performing a Failure Mode, Effects and Criticality Analysis. U.S. Department of Defense. 1949. (MIL–P–1629).
- Textron, Inc. (https://www.slideshare.net/handbook/qm085design-andd-process-fmea)
- Wheeler, D., “Problems with Risk Priority Numbers – Avoiding More Numerical Jabberwocky,” Quality Digest, June 2011, www.qualitydigest.com/inside/quality-insider-article/problems-risk-priority-numbers.html
- Killilea, M.C., “Cleaning Validation: Viracept, 2007,” Journal of Validation Technology, November 2012, Vol. 18, Issue 4, www.ivtnetwork.com/jvt-journal.
- "Guideline on setting health based exposure limits for use in risk identification in the manufacture of different medicinal products in shared facilities" European Medicines Agency 20 November 2014