
Improving Quality Standards For Elastomer Stoppers In Parenteral Drug Manufacturing
By Mike Haley, AbbVie; Dave Hile, Shire; Laurent Screve, GSK; Nick Dyar, Biogen; and Malcolm Gilmore, BioPhorum Operations Group

The purpose of this paper is to:
- understand the particle count methods currently used
- identify where the major differences in particle count methods lie
- provide thought on the areas where improvements and consistency need to be sought.
The BioPhorum Operations Group (BPOG) Stopper Quality team is a biopharmaceutical industry collaboration focused on improving baseline quality standards for elastomeric vial stoppers used in the manufacture of parenteral drug products. The Stopper Quality team leverages the BPOG platform to facilitate benchmarking and best practices implementation across member companies. In addition, the team partners and engages with external suppliers to identify improvements in stopper quality that will benefit patients and biopharmaceutical and stopper manufacturers.
Biopharmaceutical manufacturers, suppliers, and regulators have a responsibility to patients to continuously improve the quality of drug products. An important element of product quality relates to visible particulates. Specifically, compendial and regulatory bodies share the expectation that every lot of parenteral drug product be “essentially free” of visible particulates. Manufacturing parenteral drugs that are essentially free of particulates remains a complex and difficult task. When particulates are detected in sterile injectable drug products prior to release, this can result in delayed product release, component inventory loss, additional vision inspection time, and drug shortages. When detected in the marketplace, the impact may be product recalls, warning letters, investigation time and cost, drug shortages, and — most importantly — potential risk to patient safety. For example, a summary of FDA sterile injectable drug recalls during the period 2008-2012 revealed that 22 percent of all recalls were particulate-related.1
Consistently producing lots that are essentially free of particulates requires biopharmaceutical manufacturers to use a comprehensive control strategy. A major component of this is elastomer stoppers for vials, which are product-contact primary packaging components. Like other product-contact components, stoppers are a known source of particulate contamination. This is, in part, due to various physical and technological limitations inherent to the stopper manufacturing process. As a quantitative control measure, stopper manufacturers perform a battery of release tests to determine lot acceptability against established quality standards. Among the universally required release tests is particulate load of a representative sample. Elastomer stoppers are commonly tested under guidance provided through ISO 8871-3. During BPOG engagement with several stopper suppliers, it became apparent that multiple elements of this particle count method — including, but not limited to, equipment, environment, and particle classification — varied across the different suppliers. Consequently, the BPOG Stopper Quality team determined a need to undertake a comparative analysis of the test methods and constituent variables that are currently utilized by stopper manufacturers. This paper is intended to highlight testing inconsistencies and drive the collaborative development of a more sensitive, harmonized particle count method.
In 2014, 13 companies in the BPOG fill finish community conducted a survey to determine the most frequent types of defects experienced with elastomer stoppers, the results of which clearly demonstrate that particulate contamination is the single largest issue.2
The team identified and agreed on target control levels for particulate contamination, based on the levels currently achieved by stopper manufacturers.2
It became apparent that the methods used to determine the level of particles in stoppers were both varied and unable to reliably detect particles at the levels currently achieved, let alone the lower levels being proposed. This is a significant issue because there is a need to consistently measure and establish current baseline levels, which in turn can be used to track improvements in the levels of particle contamination.
ISO 8871-3, Elastomeric parts for parenterals and for devices for pharmaceutical use – Part 3: Determination of released-particle count is the current standard for counting particles in elastomeric stoppers. The standard was issued in August 2003, and it is purely focused on released particles — rather than embedded particles affecting CCI particles. The standard outlines methods to count both visible and sub-visible particles. It also specifies the reporting information that should be included.
The team set out to understand whether ISO 8871-3 was consistently applied and, if not, identify the different count methods used in the biopharmaceutical industry and by suppliers, to identify where differences exist and to critique methods to understand which areas in the particle count methods have the greatest impact on the results obtained. This in turn allowed the team to identify the stages of the count methods that need to be improved and that need to be consistent across the industry.
Comparing Particle Count Methods
Seven BPOG member organizations (end users) and three stopper manufacturers responded to a questionnaire, which asked how they measured counts of visible and sub-visible particles. They were asked about the following parameters:
- particle size class
- the apparatus used for the test
- the environment in which the test is conducted
- blank tests
- the actual test
- the test report.
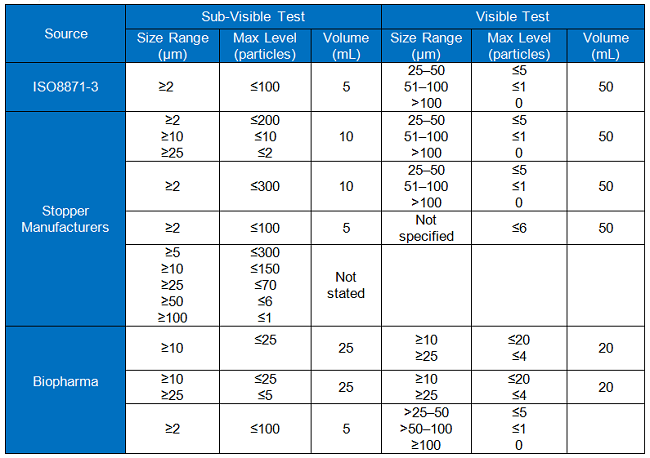
These parameters are the key areas highlighted in ISO 8871-3. The standard is divided into two methods: one that deals with visible particles and the other with sub-visible. The standard defines sub-visible particles as those ≤25µm in diameter. For this paper, visible and sub-visible particles will be considered separately.
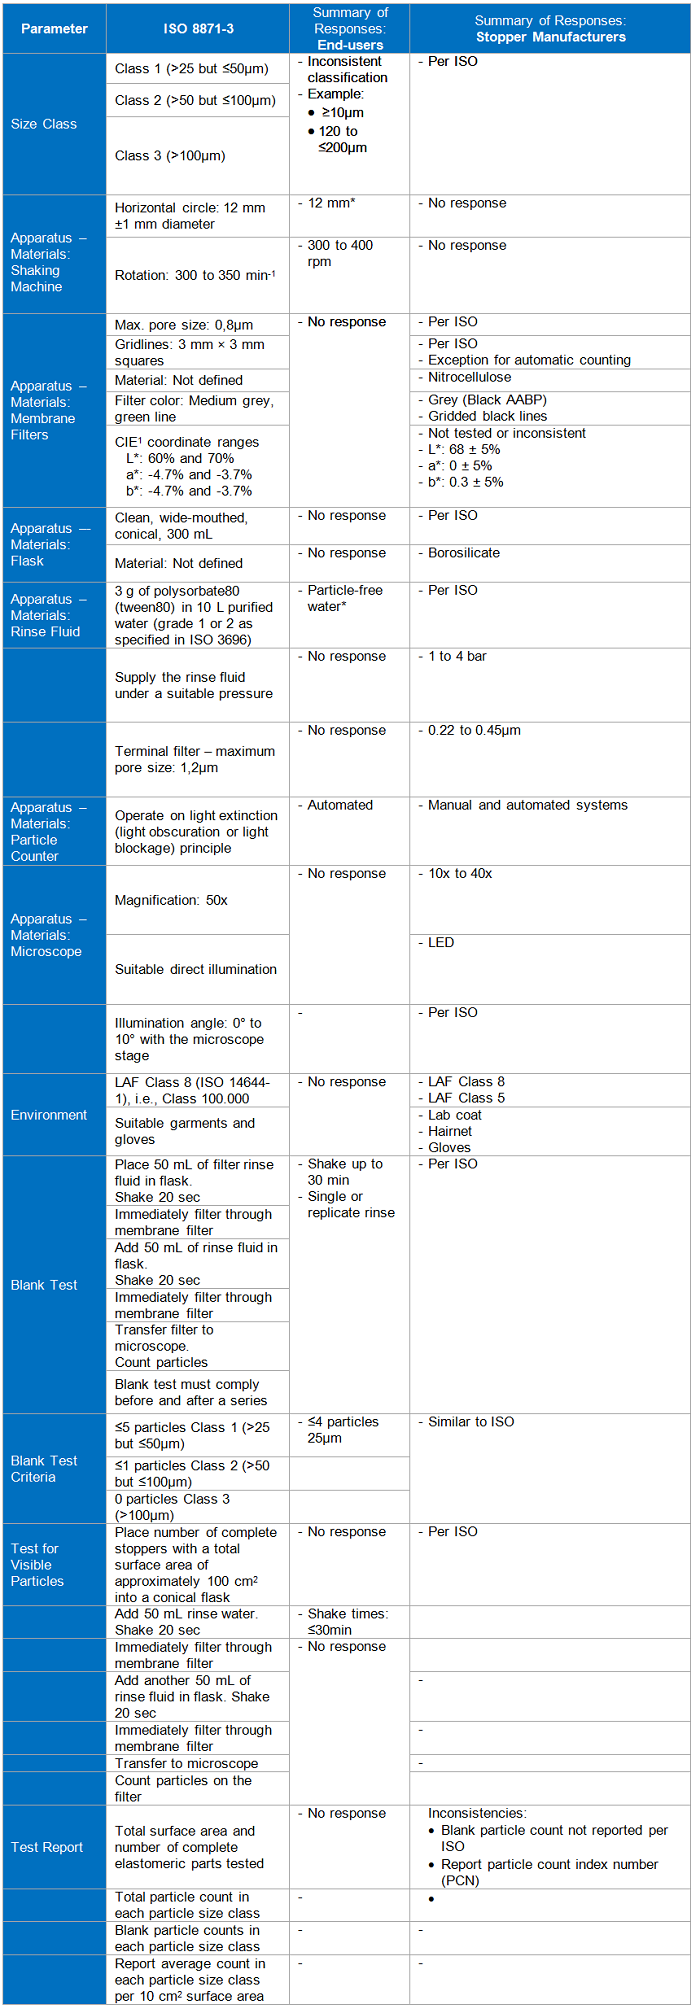
Visible Particles
Table 1
Sub-Visible Particles
Table 2
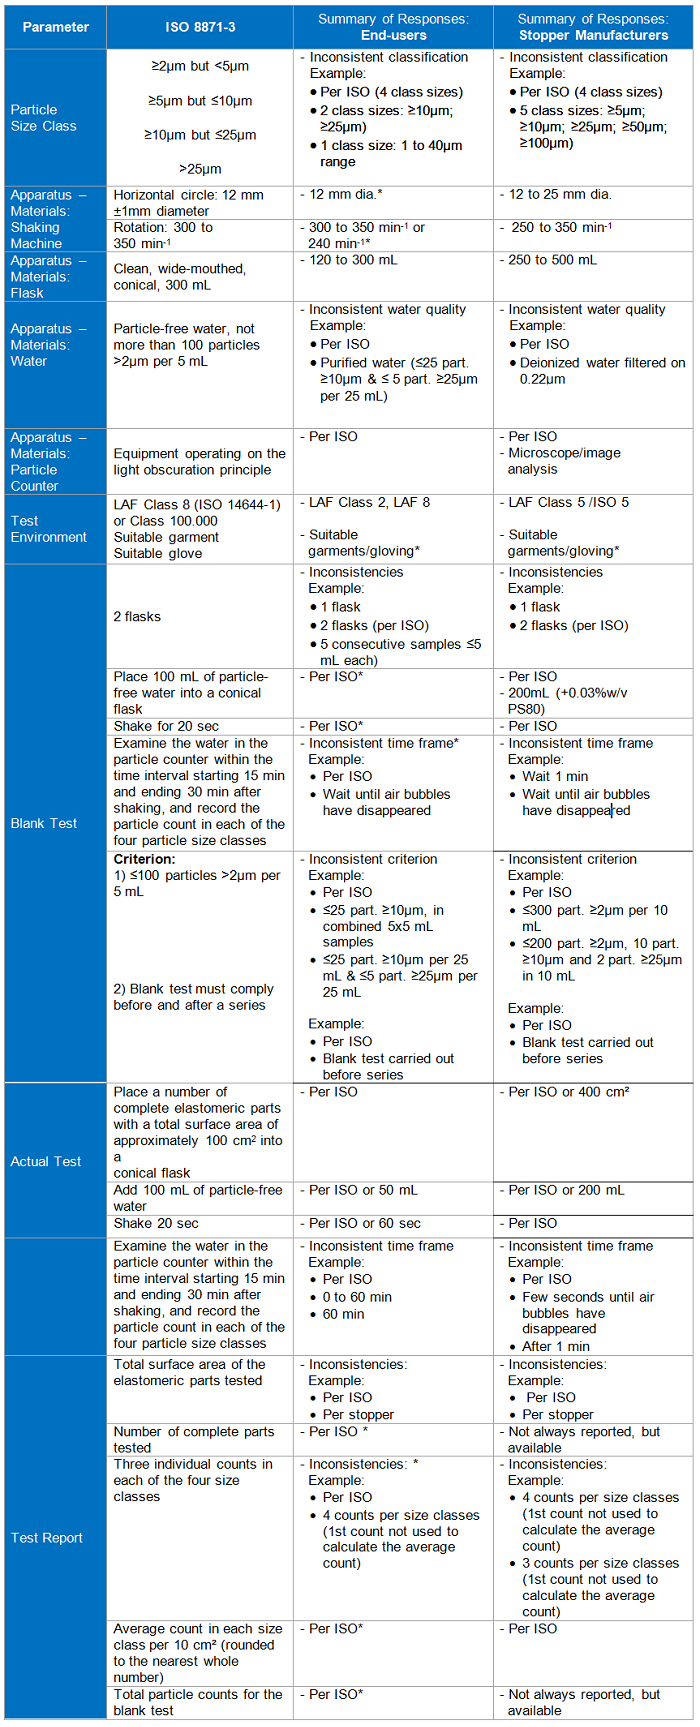
*Low end-user response; 1International Commission on Illumination
Note all references to “ISO” refer to ISO 8871-3.
Discussion
There are several factors that impact stopper particle count results, and significant differences in particle count methodology will increase the inherent variability among testing laboratories. For example, at Interphex 2015, Andy Polywacz and Jennifer Riter from West Pharmaceutical Services discussed particle count methodologies and the potential for differences in the methods to affect the result. They highlighted several factors that may affect the result, which are summarized in Figure 1 (reproduced with their kind permission). The factor risk assessments emphasized the rigor required to evaluate particle levels in stoppers and the challenges associated with comparing results among testing laboratories.
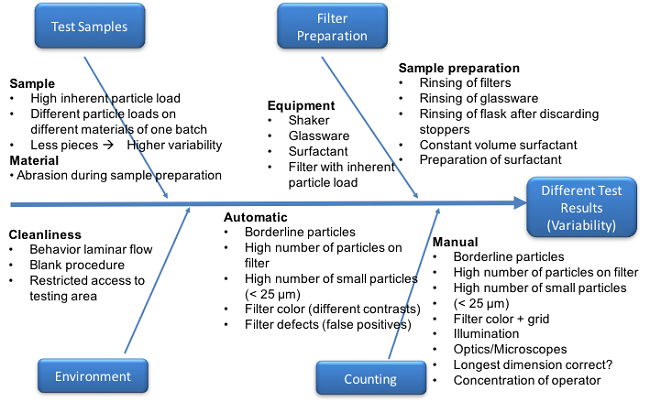
Figure 1
The BPOG particle count methodology survey identified differences among the methods specified in the ISO standard for both visible and sub-visible particles and the methods used in industry. These differences are noted in all areas of the ISO standard test method and in result reporting and classification of particles. These differences prevent end users from comparing baseline particle levels in stoppers from manufacturers and effectively tracking improvements in particle levels. It should be also noted that users of ISO 8871-3 are allowed considerable variations in test procedures while maintaining compliance.
The team wanted to identify which areas could potentially have the greatest effect on result and hence the areas on which we need to drive consistency and leave less to interpretation.
BPOG identified five key areas that require consistency (see Table 3). To determine the impact of each area, subject matter experts within BPOG member organizations were surveyed. They gave both company and individual independent opinions, based on their analytical expertise, on the importance of standardization for each area of the particle count methods to ensure reliable and comparable results. The survey results and conclusions are summarized for each methodology area following Table 3.
Table 3
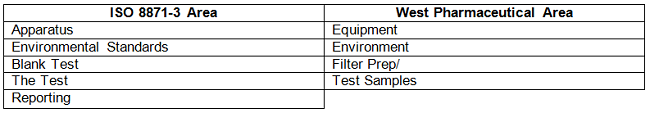
Each section highlighted in ISO 8871-3 is dealt with in turn:
Apparatus
Apparatus refers to the equipment used for particle extraction and testing. The most critical element identified in this section was the purity of water used to wash the stoppers and the need for consistent quality of water with respect to the purified water’s residual particle contamination. This was the case for both visible and sub-visible particles. The importance of water quality is addressed within the blank test area. Using the same physical equipment was not regarded as important, provided they were both accurate and precise.
Environmental Standards
Environmental standards refer to the air environment used during sample preparation and testing, as well as dress or gowning requirements for analysts. This was regarded as an important factor for both visible and sub-visible particles. Controlled room air environments of at least Class 8 or lower are recommended to prevent potential particle contamination. Either controlled air rooms or hoods may be used to provide an adequate environment. Analyst gowning should be adequate for the environment and selected to prevent particle shedding and potential contamination.
Blank Test
The blank test serves as a negative control to ensure consistent and sensitive levels of particles in the rinse water, or “blank water,” and is important to demonstrate suitability of each test. As such, survey respondents deemed a common specification for blank water important. Baseline particle levels in the rinse water must be at a low enough signal to noise ratio to allow detection of particles at the levels being sought in elastomeric stoppers. Table 4 compares specifications for blank water between the ISO method, three stopper manufacturers, and four biopharma BPOG member organizations.
Table 4
The information in the table shows that there are differences in criteria, which may be summarized as:
- The criteria used by both the stopper manufacturers and biopharma companies to determine acceptability for sub-visible particles do not comply with the standards required by ISO 8871-3.
- Stopper manufacturers meet the criteria used to determine acceptability for visible particles.
- Two out of the three biopharma companies use different criteria than ISO 8871-3 for visible particles.
- The volumes of water used differ.
Given the industry need to detect particles at lower levels than it did 14 years ago when ISO 8871-3 was published, and the variation in the acceptance criteria currently observed, the following recommendations are made:
- Stopper manufacturers and biopharma manufacturers should adopt the same acceptance criteria for water used in the test.
- Lower particle limits should be introduced to reflect modern needs.
Testing Elastomer Stoppers
There are several differences in how the test is performed. Examples are given below.
There were differences reported in the number of stoppers used per test. Some organizations base the number on the surface area of stoppers, some on the diameter of the stopper, and others make no distinction.
The volume and makeup of the fluid used for the tests differed, with the reported volume of water used by biopharma companies varying between 50 and 200 mL. Manufacturers harmonize around ISO (100 mL).
Shake times among manufacturers were consistent with ISO at 20 seconds. One biopharma company used 60 seconds, which was greater than the ISO recommendation.
The view of the subject matter experts was that the shake time needs to be consistent. There also should be emphasis on controlling the amount of stopper used in the test.
It was also noted that no guidance is given on the specific particle size methods used. This could introduce variability, and guidance is needed on the overall methods to be employed.
Particle size results can vary between testing laboratories and between counting methodologies (e.g., light obscuration versus flow imaging), especially for the sub-visible range. For example, Dean Ripple et al 2014 (An interlaboratory comparison of sizing and counting of sub-visible particles mimicking protein aggregates, Pharmaceutical Biotechnology) reported sub-visible particle results among 22 laboratories testing National Institute of Standards and Technology-developed reference materials prepared from ethylene tetra-fluoroethylene (ETFE). This study reported standard deviations up to approximately 50 percent and differences observed between counting methods used, including light obscuration and flow imaging. A comparison of particle count methodology is beyond the scope of this paper and can be evaluated once other method areas have been harmonized.
However, light obscuration is the method utilized in USP 788; therefore, this should be considered the standard for this application.
Reporting Results
Differences in result reporting were noted for size classifications of results.
For sub-visible result reporting, most manufacturers and end users are harmonized around the particle size classifications in the ISO method.
For stopper manufacturers, sub-visible results, especially for the smaller classifications, are not always specified, but data is available for information. More differences were noted in the reporting of visible particle results, where visible particle results are either not reported or survey respondents did not specify how these results are reported.
Differences were also noted in the units of reported results.
Conclusion
The BPOG particle count methodology survey highlighted several key areas that affect manufacturers’ and biopharma companies’ ability to baseline, and track improvements for, the residual level of particles associated with stoppers.
Significant variation can be found when comparing the current analysis and reporting methods to determine particulate levels associated with elastomer stoppers used by both stopper manufacturers and biopharma end users. The test reports issued do not routinely meet the requirements of ISO 8871-3, which is 14 years old and in need of update. The updating process should be used to facilitate the alignment of stopper manufactures and biopharma companies around one precise method that provides detection of particles at the levels needed by the industry.
There is a need to harmonize across all areas of the particle count methods (particle size class; the apparatus used for the test; the environment in which the test is conducted; blank tests; the actual test and the test report).
The residual particle levels for the water specified in ISO could have significant impact on the results of the particle count; the level permitted in clean water by the ISO is up to 50 percent of the level permitted in the stoppers. This level of residual particles in water does not permit acceptable sensitivity for reliable results and demonstration of reduced particle load in stoppers.
Biopharma organizations and the stopper manufacturers need to collaborate on the development of a harmonized and more sensitive method to determine the residual particle load on stoppers.
This harmonization will allow users to reliably detect and baseline particles that originate from a wide range of potential sources, including stopper manufacturing processes, particles that may be inherent in the primary packaging containers for ready-to-use or ready-to-sterilize stoppers, and changes to particle levels due to shipping and storage of stoppers.
References:
- Lynn, S. Drug Defects. Presented at the 37th International Good Manufacturing Practices Conference. March 14, 2013, Athens, GA
- Gilmore, M. Elastomer Stoppers: Working Toward Adopting an Industry-Wide User Requirements Specification for Particulate Levels, BioProcess International, January 2017
- Francois Dessus, 2014, Aptar Stelmi and A3P; The control of particulate contamination in the production of elastomer plugs (Wave 34).
- Renaud Janssen, Datwyler and A3P; Particulate matter from pharmaceutical rubber closures: causes, measurement and controls
- Discussion on variability of tests, particularly that different people saw differences that affected results in filter preparation and counting. http://www.a3p.org/index.php/articles-techniques-et-scientifiques/1156-improving-visible-particulate-cleanliness-of-rubber-closures-by-operational-measures-la-vague-38.html
- Various; Particulate identification – particle identification for improvement of pharmaceutical production http://drug-dev.com/Main/Back-Issues/PARTICULATE-IDENTIFICATION-Particle-Identification-1168.aspx