
How Healthy Is The Biopharma Pipeline Heading Into 2019?
By Eduardo Schur and Rares Barbu, Navigant

An analysis of biopharmaceutical pipeline strength based on key indicators
There has been much speculation about the health of the biopharmaceutical pipeline, and questions remain about how strong the pipeline really is and what it can tell us about future expectations. We set out to answer these questions by analyzing key indicators of pipeline strength over the past three years, including research & development (R&D) spend, new chemical entity approvals, and Phase 2 and Phase 3 development. We also studied pricing and performance data to determine key challenges and considerations for products launching in 2019 and beyond.
By all accounts, 2018 was a productive year for the industry. Worldwide R&D spending rose 3.5 percent from 2016 to 2018 to a total of $161 billion, new chemical entity approvals more than doubled over the same period from 22 to 56, and pipelines remain robust, with significant growth in late-stage development. Based on this data, we anticipate a promising year ahead for manufacturers and patients.
Innovation Is Alive And Well
A total of 59 new chemical entities gained FDA approval in 2018, reflecting a 28.3 percent increase from 2017 and a 168 percent increase from 2016 approvals. This trend may continue in 2019, assuming regulatory authorities continue their efforts to strengthen communications, streamline processes, and accelerate approvals in response to increasing development in areas of unmet need. Our forecast also assumes that the FDA resumes operations and is well funded for 2019.
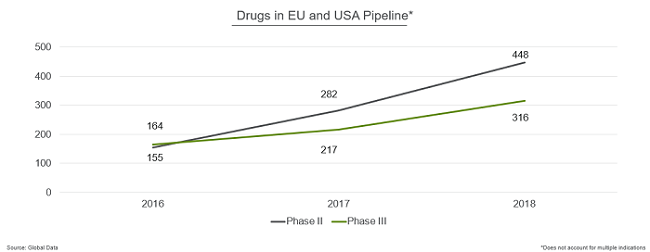
The number of assets in late-stage development also grew significantly in both U.S. and European pipelines.
- Phase 3 products increased from 164 in 2016 to 316 in 2018.
- The growth in Phase 2 was even greater, more than doubling from 155 products in 2016 to 448 in 2018.
Biologics outpaced small molecules in terms of growth, with the number of biologics increasing 54 percent over the past year vs. 37 percent for small molecules.
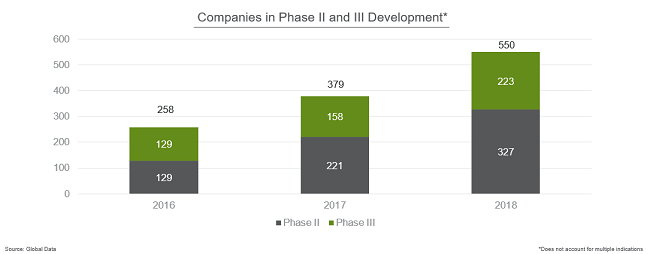
In addition, more companies experienced growth in late-stage development. In 2016, just 258 companies had products in Phase 2 or Phase 3. That number grew to 379 in 2017 and jumped further to a total of 550 companies with late-stage development programs in 2018.
With few exceptions, all the major biopharma companies show strong pipelines this year—with Novartis, Merck, Pfizer, Janssen (J&J), Roche, and AstraZeneca’s late-stage pipelines being particularly robust.
Where Is Innovation Happening Now?
It is well known that oncology is a key area of focus for innovation. But is momentum picking up in other therapeutic areas, and if so, where? Our comparative data analysis shows that the past decade has seen not only a spike in approvals, but also a shift in therapeutic areas of focus. Oncology, one of several leading areas of focus in 2008, is now the clear front-runner, with more than double the number of approvals of the next closest category. Oncology also continues its reign as the top focus of innovation, making up 25 percent of the current pipeline, with 257 products in development.
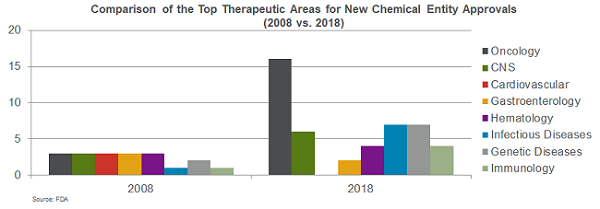
However, growth is happening across all therapeutic areas. Central nervous system (CNS) regained momentum, with approvals doubling from 2008 to 2018. Infectious diseases, genetic diseases, hematology, and immunology are also showing progress in terms of approvals. In addition, while oncology growth shows signs of potential flattening, as evidenced by 96 products in Phase 3 in 2017 vs. 103 in 2018, areas including respiratory, infectious disease, cardiovascular, immunology, gastroenterology, and CNS all experienced a surge in late-stage development over the past three years.
Going forward, three key areas to watch include cardiovascular, CNS, and infectious diseases. After a long decline, the cardiovascular pipeline appears poised for a comeback. Though approvals remained low in recent years, 2018 saw 27 cardiovascular products in Phase 2 development and 30 in Phase 3. First-in-class pipeline innovation is particularly strong in areas of unmet need within hypertension, heart failure, and dyslipidemia. CNS progress is also increasing, backed in part by new scientific discoveries and regulatory support for innovation. In this traditionally expensive and high-risk therapeutic area, a total of 18 CNS new chemical entities were approved from 2016 to 2018. Today, the Phase 2 and Phase 3 pipeline consists of 136 CNS products, with significant investments in the so-far elusive area of Alzheimer’s disease, as well as depression, migraines, multiple sclerosis, PTSD, and alternatives to currently available highly addictive pain medicines.
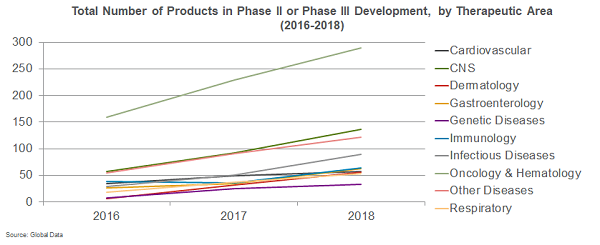
Infectious disease is also showing increased promise moving into 2019. Late-stage development growth was slow in 2016 but steadily increased to 89 products in Phase 2 or Phase 3 in 2018. A recent study led by Duke University’s Center of Policy Impact in Global Health shows strong promise for new treatments in HIV, tuberculosis, and malaria. It also identifies areas needing significant investment to increase innovation, including around developing effective vaccines for these same diseases.
What Challenges Lie Ahead For Products Coming Out Of This Healthy Pipeline?
With a strong pipeline, companies are poised for more product launches in 2019 and beyond. However, the shift in therapeutic areas of focus, the increase in products targeting higher unmet needs of smaller patient populations, and a potentially crowded marketplace bring new challenges.
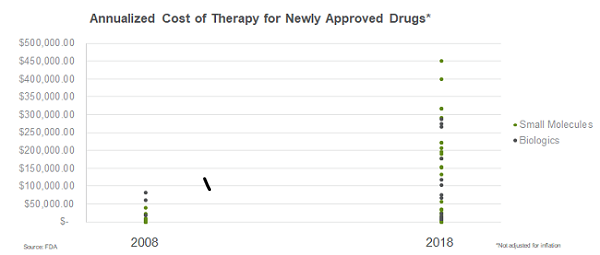
To uncover some of the key challenges companies need to prepare for, we analyzed data around pricing and launch performance. As therapeutic areas have shifted over the past decade, so has pricing. From 2008 to 2018, the range of drug prices widened five-fold, with the highest annualized cost of therapy for newly approved drugs jumping from about $82,000 to $450,000. This widening in price range holds true across both biologics and small molecules. In fact, the three highest-priced products in 2018 were small molecules.
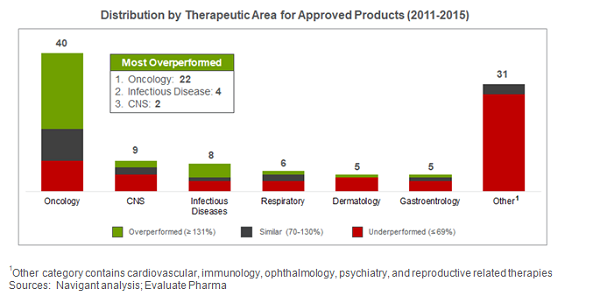
To analyze how products performed, we looked at analyst forecasting vs. actual performance data from 2011 to 2015. After filtering out products that were discontinued, irrelevant due to factors such as transfer of ownership or out-licensing, or for which we could not obtain financial data, we analyzed 104 of the 183 FDA approved drugs during this period.
From 2011 to 2015, 30 percent of products exceeded forecast expectations in first-year sales. The majority of these were in oncology, where 22 of 40 products overperformed, several due to novel mechanisms of action that demonstrated significant improvements in efficacy and safety over the existing standard of care. Infectious disease also saw four of its eight launched products overperform.
However, while performance was strong for these products, 52 percent of products underperformed prelaunch expectations. Underperformance was greatest among retail products, with 89 percent underperforming vs. 29 percent of hospital/buy and bill products and 19 percent of specialty pharmacy products. While most underperformers continued to lag postlaunch, a significant proportion improved against forecasts by year three, including products with delayed launch timing compared to their anticipated launch date and those with delayed impact of market shaping and development activities.
The question now becomes, why are products rising in price while decreasing in performance? Is it due to commercial preparedness, reimbursement, the shift to a high-cost model, or a combination of these and other factors?
With so many products poised for launch in the near future, manufacturers will need to seek answers to these critical questions. We aim to tackle them in our next article.
About The Authors:
 Eduardo Schur serves as managing director and global leader of Navigant’s Life Sciences Practice, bringing more than 28 years of experience in the pharmaceutical market. His expertise includes strategic planning, market assessments, and product launches in multiple therapeutic areas. Prior to joining Navigant, Schur was VP of marketing at Bristol-Myers Squibb and held several commercial leadership positions with Johnson & Johnson in the U.S. and abroad. Schur is a trustee at LLS-NJ Chapter and is part of the faculty at Rutgers University Edward J. Bloustein School of Planning and Public Policy.
 Rares Barbu is a life sciences consultant with Navigant. His expertise includes working with biotechnology manufacturers and providers, with a primary focus on how life science companies utilize capital to make a difference for patients while helping breakthrough therapies reach the market. Prior to joining Navigant, Rares worked in alternative asset management evaluating companies for private placement investments. Rares graduated summa cum laude from the University of Connecticut with a BS in biomedical engineering, a BGS, and a minor in material science and engineering.